I've been playing with Tate's collections data while preparing for a workshop on data visualisation. On the day I'll probably use Google Fusion Tables as an example, but I always like to be prepared so I've prepared a short exercise for creating simple graphs in Excel as an alternative.
The advantage of Excel is that you don't need to be online, your data isn't shared, and for many people, gaining additional skills in Excel might be more useful than learning the latest shiny web tool. PivotTables are incredibly useful for summarising data, so it's worth trying them even if you're not interested in visualisations. Pivot tables let you run basic functions – summing, averaging, grouping, etc – on spreadsheet data. If you've ever wanted spreadsheets to be as powerful as databases, pivot tables can help. I could create a pivot table then create a chart from it, but Excel has an option to create a pivot chart directly that'll also create a pivot table for you to see how it works.
For this exercise, you will need Excel and a copy of the sample data: tate_artist_data_cleaned_v1_groupedbybirthyearandgender.xlsx
(A plain text CSV version is also available for broader compatibility: tate_artist_data_cleaned_v1_groupedbybirthyearandgender.csv.)
Work out what data you're interested in
In this example, I'm interested in when the artists in Tate's collection were born, and the overall gender mix of the artists represented. To make it easier to see what's going on, I've copied those two columns of data from the original 'artists' file and copied them over to a new spreadsheet. As a row by row list of births, these columns aren't ideal for charting as they are, so I want a count of artists per year, broken down by gender.
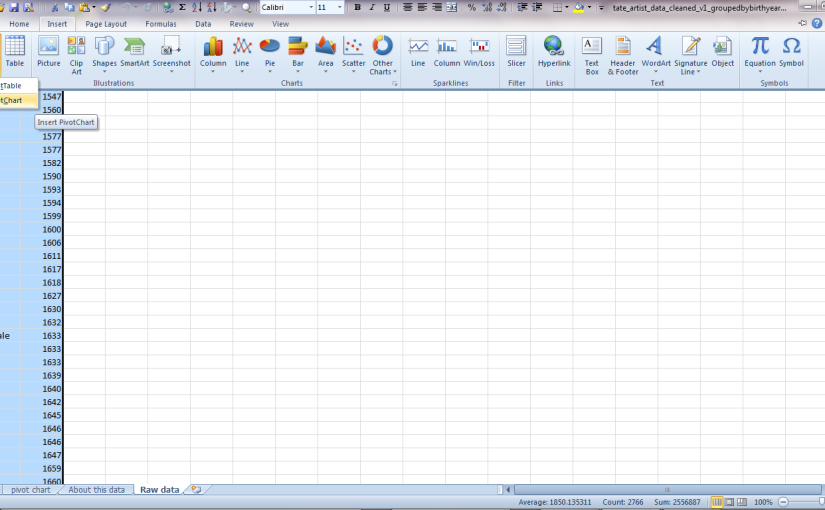
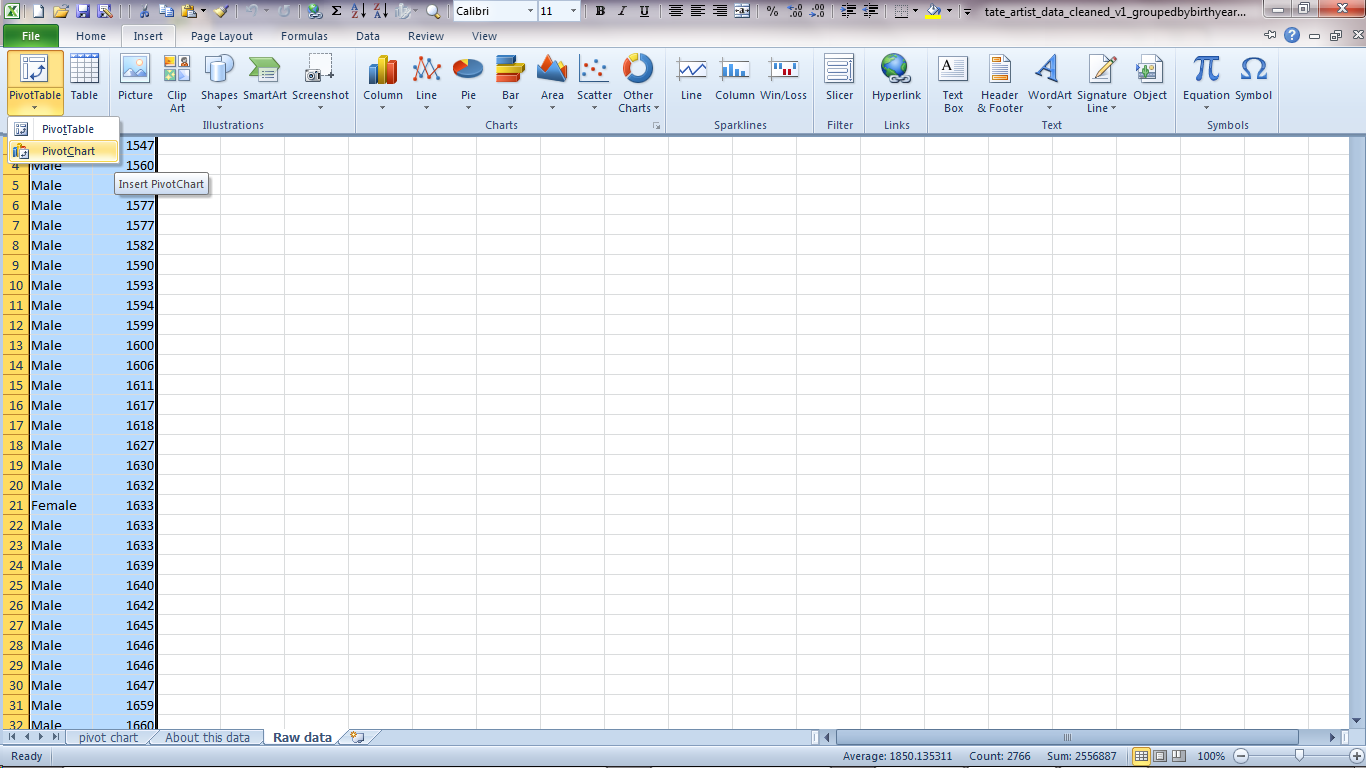
Insert PivotChart
On the 'Insert' menu, click on PivotTable to open the menu and display the option for PivotCharts.
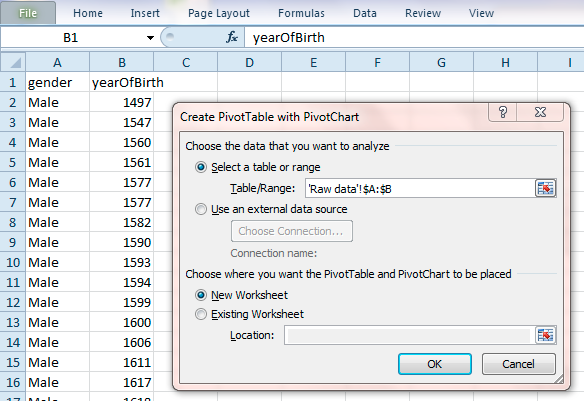
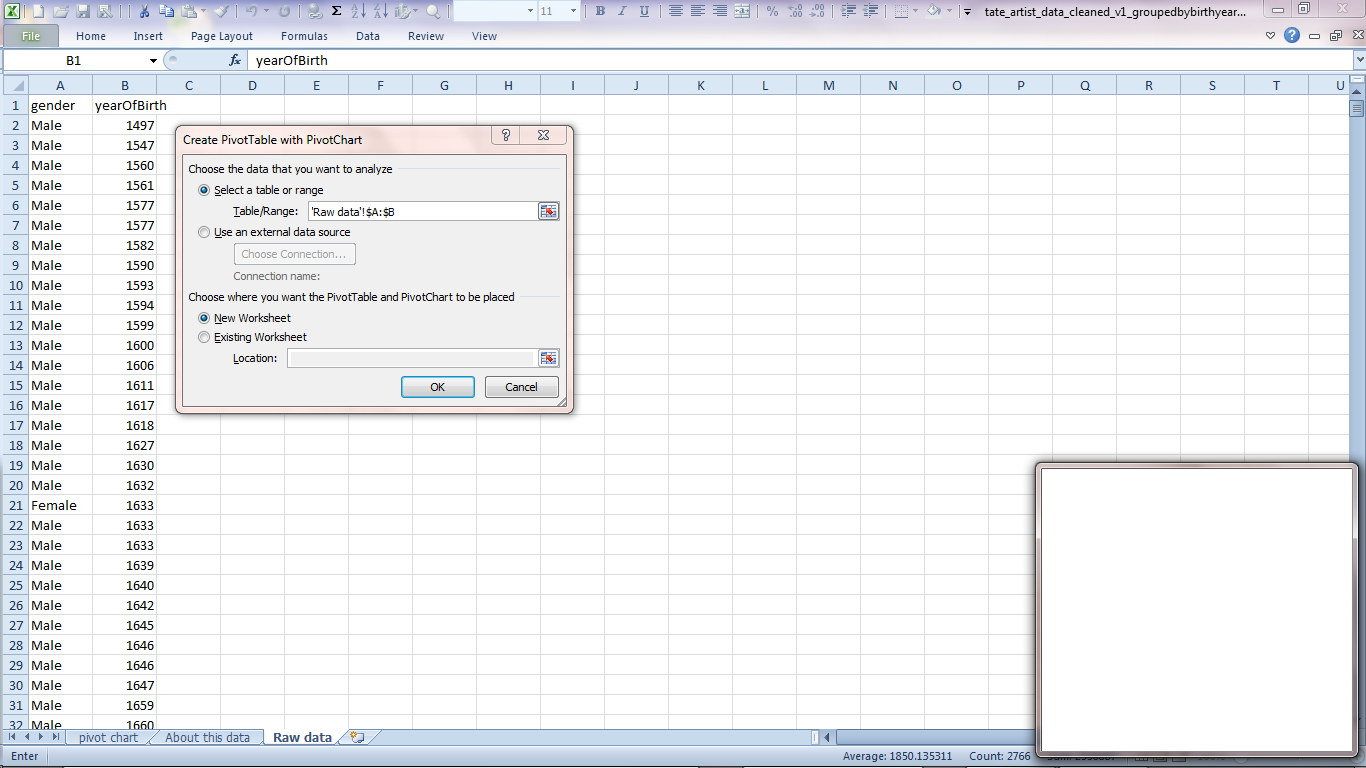
Excel will select our columns as being the most likely thing we want to chart. That all looks fine to me so click 'OK'.
 Configure the PivotChart
This screen asking you to 'choose fields from the PivotTable Field List' might look scary, but we've only got two columns of data so you can't really go wrong. 
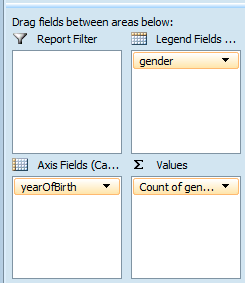
The columns have already been added to the PivotTable Field List on the right, so go ahead and tick the box next to 'gender' and 'yearofBirth'. Excel will probably put them straight into the 'Axis Fields' box.
Leave yearofBirth under Axis Fields and drag 'gender' over to the 'Values' box next to it. Excel automatically turns it into 'count of gender', assuming that we want to sum the number of births per year.
The final task is to drag 'gender' down from the PivotTable Field List to 'Legend Fields' to create a key for which colours represent which gender. You should now see the pivot table representing the calculated values on the left and a graph in the middle.
When you click off the graph, the PivotTable options disappear – just click on the graph or the data again to bring them up.
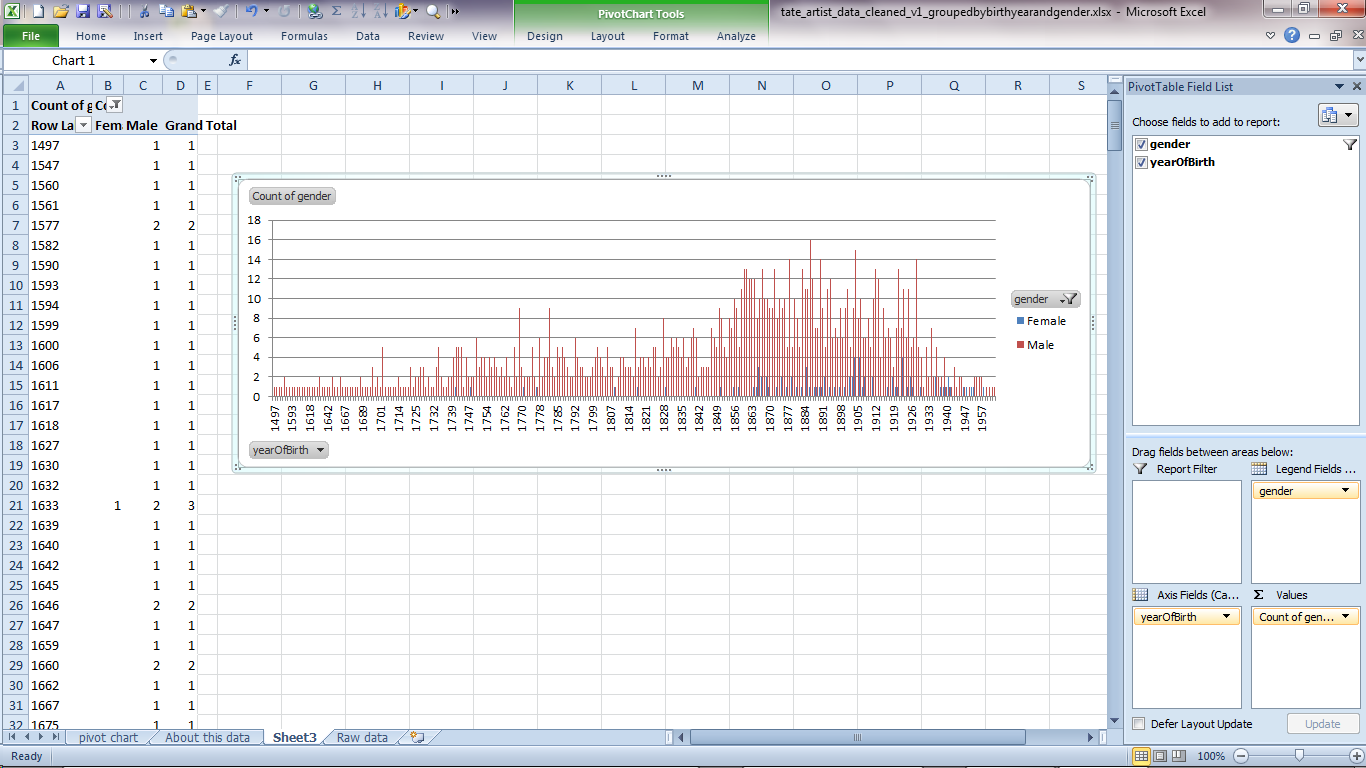
You've made your first pivot chart!
You might want to drag it out a bit so the values aren't so squished. Tate's data covers about 500 years so there's a lot to fit in.
Now you've made a pivot chart, have a play – if you get into a mess you can always start again!
Colophon: the screenshots are from Excel 2010 for Windows because that's what I have.
About the data: this data was originally supplied by Tate. The full version on Tate's website includes name, date of birth, place of birth, year of death, place of death and URL on Tate's website. The latest versions of their data can be downloaded from http://www.tate.org.uk/about/our-work/digital/collection-data The source data for this file can be downloaded from https://github.com/tategallery/collection/blob/master/artist_data.csv This version was simplified so it only contains a list of years of birth and the gender of the artist. Some blank values for gender were filled in based on the artist's name or a quick web search; groups of artists or artists of unknown gender were removed as were rows without a birth year. This data was prepared in March 2015 for a British Library course on 'Data Visualisation for Analysis in Scholarly Research' by Mia Ridge.
I'd love to hear if you found this useful or have any suggestions for tweaks.