The most important question to keep in mind is: how effective is the front page at making you want to participate in a project? How does it achieve that?
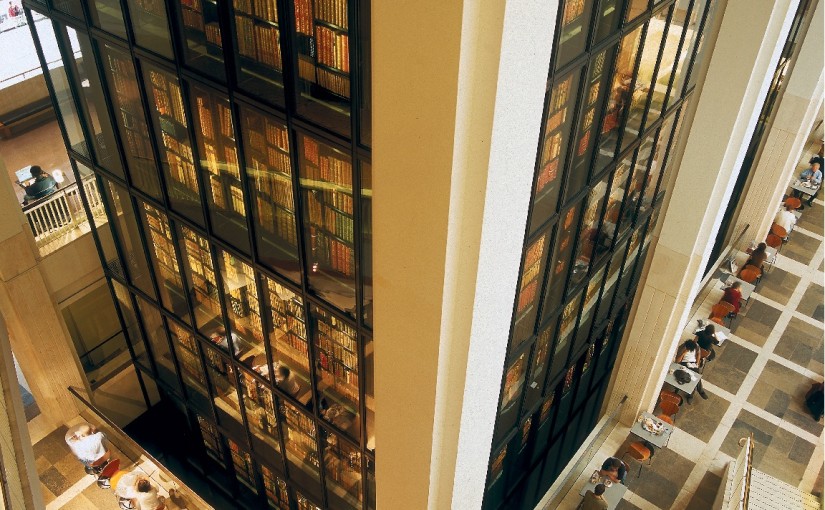
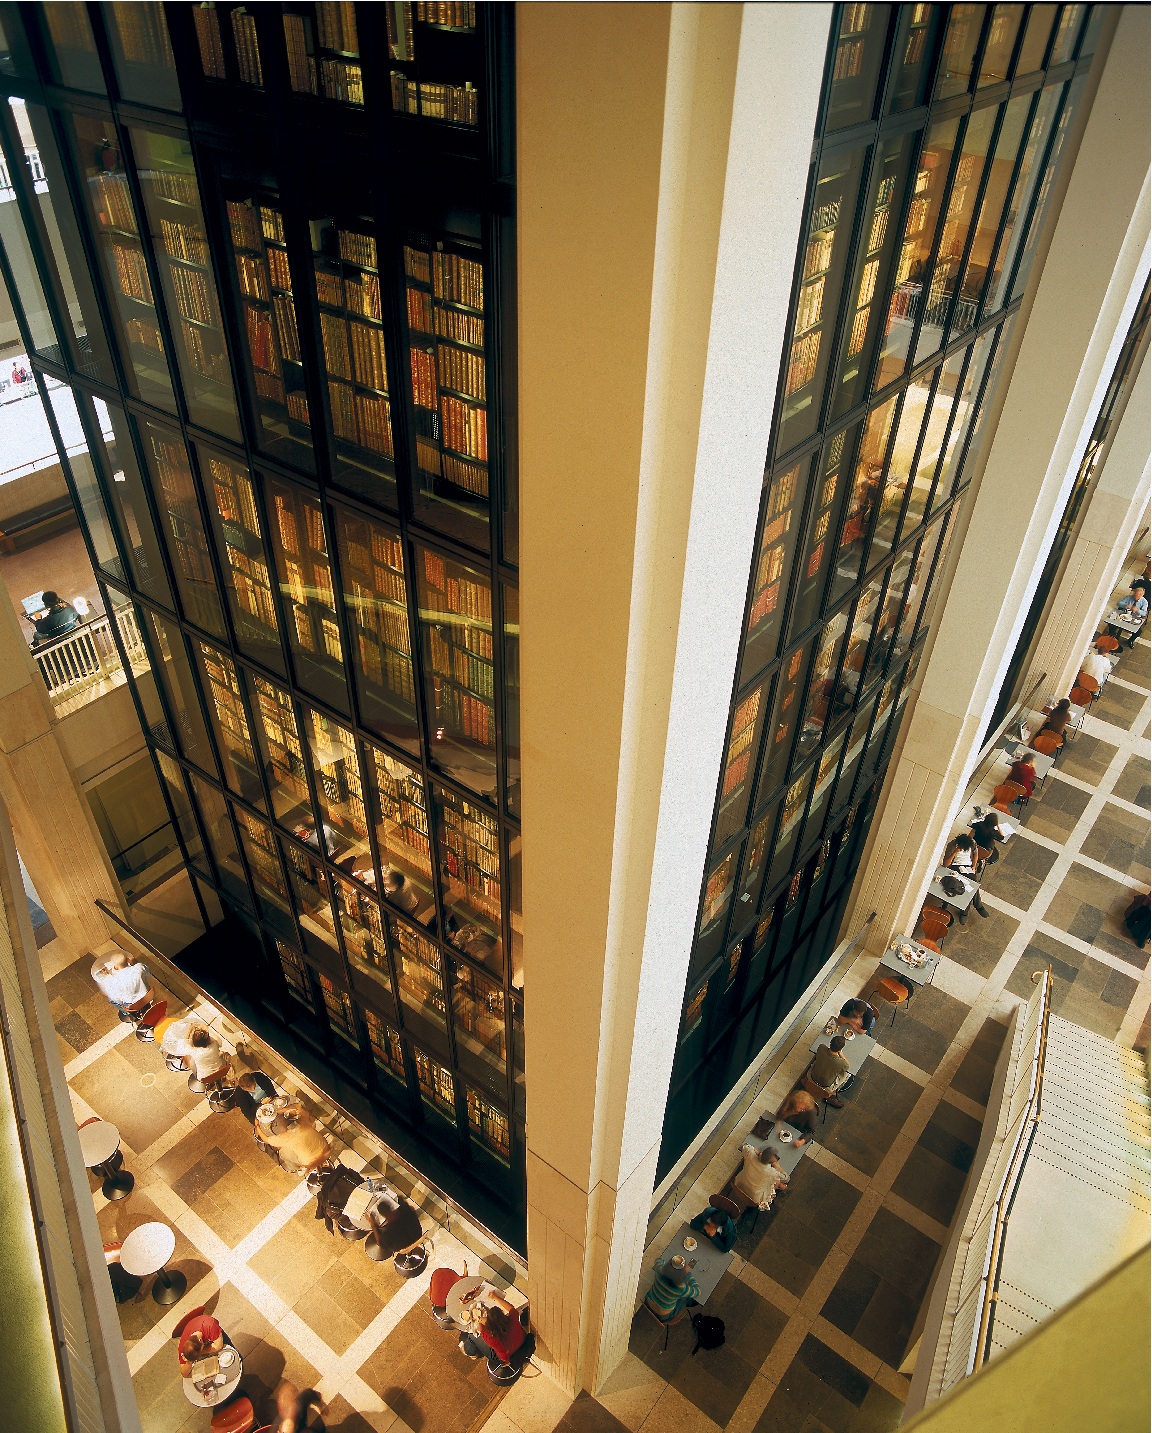
I have a new job! I'm the newest Digital Curator at the British Library. That link takes you to a post on the BL blog for a bit more about what my job involves. If you've read any of my posts over the past couple of years, you'll know that working to encourage digital scholarship is a pretty good fit for my research and teaching interests.
In other news, I passed my PhD viva! I've got a couple of minor corrections to fit in around work and various papers, and then my PhD is over! (Unless I decide to publish from my thesis, of course…)
I'm at the British Museum today for the Museums Computer Group's annual UK 'Museums on the Web' conference. UKMW15 has a packed line-up full of interesting presentations. As Chair of the MCG, I briefly introduced the event. My notes are below, in part to make sure that everyone who should be thanked is thanked! You can read a more polished version of this written with my Programme Committe Co-Chair Danny Birchall in a Guardian Culture Professionals article, 'How digital tech can bridge gaps between museums and audiences'.
UK Museums on the Web 2015: 'Bridging Gaps, Making Connections' #UKMW15
I'd like to start by thanking everyone who helped make today happen, and by asking the MCG Committee Members who are here today to stand up, so that you can chat to them, ideally even thank them, during the day. For those who don't know us, the Museums Computer Group is a practitioner-lead group who work to connect, support and inspire anyone working in museum technology. (There are lots of ways to get involved – we're electing new committee members at our AGM at lunchtime, and we will also be asking for people to host next year's event at their museum or help organise a regional event.)
I'd particularly like to thank Ina Pruegel and Jennifer Ross, who coordinated the event, the MCG Committee members who did lots of work on the event (Andrew, Dafydd, Danny, Ivan, Jess, Kath, Mia, Rebecca, Rosie), and the Programme Committee members who reviewed presentation proposals sent in. They were: co-chairs: Danny Birchall and Mia Ridge, with Chris Michaels (British Museum), Claire Bailey Ross (Durham University), Gill Greaves (Arts Council England), Jenny Kidd (Cardiff University), Jessica Suess (Oxford University Museums), John Stack (Science Museum Group), Kim Plowright (Mildly Diverting), Matthew Cock (Vocal Eyes), Rachel Coldicutt (Friday), Sara Wajid (National Maritime Museum), Sharna Jackson (Hopster), Suse Cairns (Baltimore Museum of Art), Zak Mensah (Bristol Museums, Galleries & Archives).
And of course I'd like to thank the speakers and session chairs, the British Museum, Matt Caines at the Guardian, and in advance I'd like to thank all the tweets, bloggers and photographers who'll help spread this event beyond the walls of this room.
Which brings me to the theme of the event, 'Bridging Gaps, Making Connections'. We've been running UK Museums on the Web since 2001; last year our theme was 'museums beyond the web' in recognition that barriers between 'web teams' and 'web projects' and the rest of the organisation were breaking down. But it's also apparent that the gap between tiny, small, and even medium-sized museums and the largest, best-funded museums meant that digital expertise and knowledge had not reached the entire sector. The government's funding cuts and burnout mean that old museum hands have left, and some who replace them need time to translate their experience in other sectors into museums. Our critics and audiences are confused about what to expect, and museums are simultaneously criticised for investing too much in technologies that disrupt the traditional gallery and for being 'dull and dusty'. Work is duplicated across museums, libraries, archives and other cultural organisations; academic and commercial projects sometimes seem to ignore the wealth of experience in the sector.
So today is about bridging those gaps, and about making new connections. (I've made my own steps in bridging gaps by joining the British Library as a Digital Curator.) We have a fabulous line-up representing the wealth and diversity of experience in museum technologies.
So take lots of notes to share with your colleagues. Use your time here to find people to collaborate with. Tweet widely. Ask MCG Committee members to introduce you to other people here. Let people with questions know they can post them on the MCG discussion list and connect with thousands of people working with museums and technology. Now, more than ever, an event like this isn't about technology; it's about connecting and inspiring people.
Ironically, the internet was down on the evening of Ada Lovelace Day 2015, an annual, international 'celebration of the achievements of women in science, technology, engineering and maths (STEM)', so I couldn't post at the time. Belatedly, the people whose achievements I've admired are:
Professor Monica Grady, whose joy when the probe Philae successfully landed on the Rosetta comet is just about the most wonderful thing on the internet (and she worked on one of the instruments on board, which is very cool). Like New Horizons sending back images of Pluto, it's a reminder of the awe-inspiring combination of planning, foresight, science and engineering in space that has made 2015 so interesting.
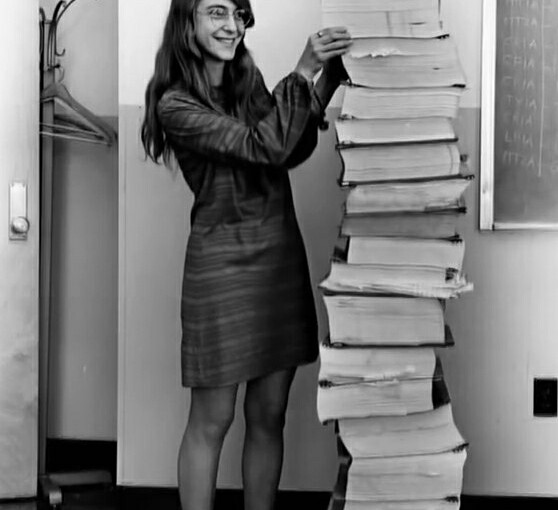
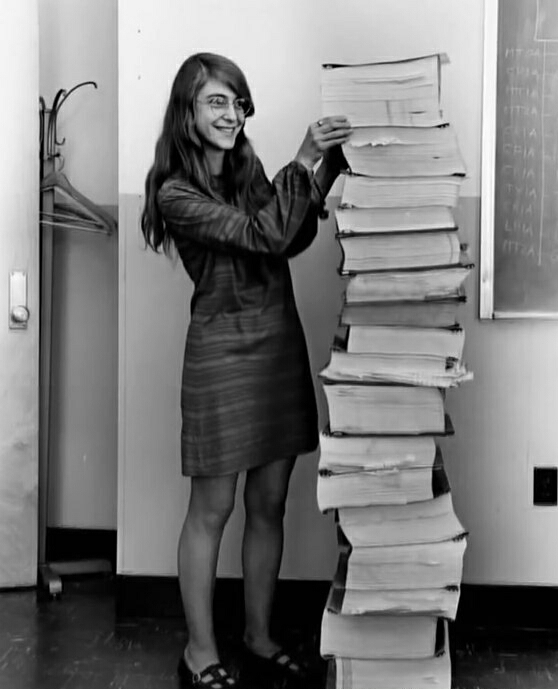
Finally, I love this image of Margaret Hamilton, lead software engineer on Project Apollo (1969), with some of the Apollo Guidance Computer (AGC) source code.
Back in September last year I blogged about the implications for cultural heritage and digital humanities crowdsourcing projects that used simple tasks as the first step in public engagement of advances in machine learning that mean that fun, easy tasks like image tagging and text transcription could be done by computers. (Broadly speaking, 'machine learning' is a label for technologies that allow computers to learn from the data available to them. It means they don't have to specifically programmed to know how to do a task like categorising images – they can learn from the material they're given.)
One reason I like crowdsourcing in cultural heritage so much is that time spent on simple tasks can provide opportunities for curiosity, help people find new research interests, and help them develop historical or scientific skills as they follow those interests. People can notice details that computers would overlook, and those moments of curiosity can drive all kinds of new inquiries. I concluded that, rather than taking the best tasks from human crowdsourcers, 'human computation' systems that combine the capabilities of people and machines can free up our time for the harder tasks and more interesting questions.
I've been thinking about 'ecosystems' of crowdsourcing tasks since I worked on museum metadata games back in 2010. An ecosystem of tasks – for example, classifying images into broad types and topics in one workflow so that people can find text to transcribe on subjects they're interested in, and marking up that text with relevant subjects in a final workflow – means that each task can be smaller (and thereby faster and more enjoyable). Other workflows might validate the classifications or transcribed text, allowing participants with different interests, motivations and time constraints to make meaningful contributions to a project.
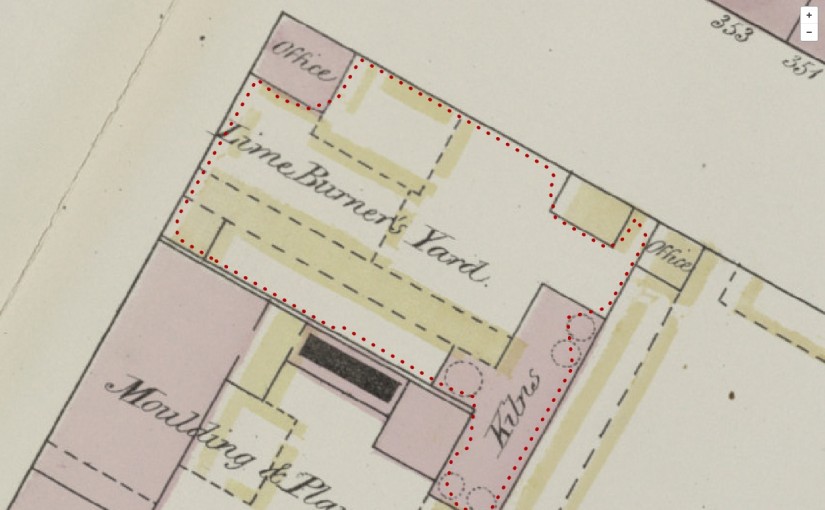
The New York Public Library's Building Inspector is an excellent example of this – they offer five tasks (checking or fixing automatically-detected building 'footprints', entering street numbers, classifying colours or finding place names), each as tiny as possible, which together result in a complete set of checked and corrected building footprints and addresses. (They've also pre-processed the maps to find the building footprints so that most of the work has already been done before they asked people to help.)
Check building footprints in NYPL's Building Inspector
After teaching 'crowdsourcing cultural heritage' at HILT over the summer, where the concept of 'ecosystems' of crowdsourced tasks was put into practice as we thought about combining classification-focused systems like Zooniverse's Panoptes with full-text transcription systems, I thought it could be useful to give some specific examples of ecosystems for human computation in cultural heritage. If there are daunting data cleaning, preparation or validation tasks necessary before or after a core crowdsourcing task, computational ecosystems might be able to help. So how can computational ecosystems help pre- and post-process cultural heritage data for a better crowdsourcing experience?
While older ecosystems like Project Gutenberg and Distributed Proofreaders have been around for a while, we're only just seeing the huge potential for combining people + machines into crowdsourcing ecosystems. The success of the Smithsonian Transcription Center points to the value of 'niche' mini-projects, but breaking vast repositories into smaller sets of items about particular topics, times or places also takes resources. Machines can learn to classify source material by topic, by type, by difficulty or any other system that crowdsourcers can teach it. You can improve machine learning by giving systems 'ground truth' datasets with (for example) a crowdsourced transcription of the text in images, and as Ted Underwood pointed out on my last post, comparing the performance of machine learning and crowdsourced transcriptions can provide useful benchmarks for the accuracy of each method. Small, easy correction tasks can help improve machine learning processes while producing cleaner data.
Computational ecosystems might be able to provide better data validation methods. Currently, tagging tasks often rely on raw consensus counts when deciding whether a tag is valid for a particular image. This is a pretty crude measure – while three non-specialists might apply terms like 'steering' to a picture of a ship, a sailor might enter 'helm', 'tiller' or 'wheelhouse', but their terms would be discarded if no-one else enters them. Mining disciplinary-specific literature for relevant specialist terms, or finding other signals for subject-specific expertise would make more of that sailor's knowledge.
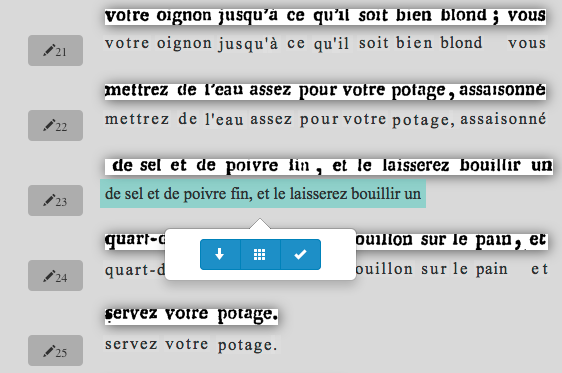
Computational ecosystems can help at the personal, as well as the project level. One really exciting development is computational assistance during crowdsourcing tasks. In Transcribing Bentham … with the help of a machine?, Tim Causer discusses TSX, a new crowdsourced transcription platform from the Transcribe Bentham and tranScriptorium projects. You can correct computationally-generated handwritten text transcription (HTR), which is a big advance in itself. Most importantly, you can also request help if you get stuck transcribing a specific word. Previously, you'd have to find a friendly human to help with this task. And from here, it shouldn't be too difficult to combine HTR with computational systems to give people individualised feedback on their transcriptions. The potential for helping people learn palaeography is huge!
Better validation techniques would also improve the participants' experience. Providing personalised feedback on the first tasks a participant completes would help reassure them while nudging them to improve weaker skills.
Most science and heritage projects working on human computation are very mindful of the impact of their choices on the participants' experience. However, there's a risk that anyone who treats human computation like a computer science problem (for example, computationally assigning tasks to the people with the best skills for them) will lose sight of the 'human' part of the project. Individual agency is important, and learning or mastering skills is an important motivation. Non-profit crowdsourcing should never feel like homework. We're still learning about the best ways to design crowdsourcing tasks, and that job is only going to get more interesting.
I was in London this week for the Linked Pasts event, where I presented on trends and practices for open data in cultural heritage. Linked Pasts was a colloquium on linked open data in cultural heritage organised by the Pelagios project (Leif Isaksen, Elton Barker and Rainer Simon with Pau de Soto). I really enjoyed the other papers, which included thoughtful, grounded approaches to structured data for historical periods, places and people, recognition of the importance of designing projects around audience needs (including user research), the relationship between digital tools and scholarly inquiry, visualisations as research tools, and the importance of good infrastructure for digital history.
My discussion points are based on years of conversations with other cultural heritage technologists in museums, libraries, and archives, but inevitably I'll have blind spots. For example, I'm focusing on the English-speaking world, which means I'm not discussing the great work that Dutch and Japanese organisations are doing. I've undoubtedly left out brilliant specific examples in the interests of focusing on broader trends. The point is to start conversations, to bring issues out into the open so we can collectively decide how to move forward.
The good
The good news is that more and more open cultural data is being published. Organisations have figured out that a) nothing bad is likely to happen and that b) they might get some kudos for releasing open data.
Generally, organisations are publishing the data that they have to hand – this means it's mostly collections data. This data is often as messy, incomplete and fuzzy as you'd expect from records created by many different people using many different systems over a hundred or more years.
…the bad…
Copyright restrictions mean that images mightn't be included. Furthermore, because it's often collections data, it's not necessarily rich in interpretative information. It's metadata rather than data. It doesn't capture the scholarly debates, the uncertain attributions, the biases in collecting… It certainly doesn't capture the experience of viewing the original object.
Licensing issues are still a concern. Until cultural organisations are rewarded by their funders for releasing open data, and funders free organisations from expectations for monetising data, there will be damaging uncertainty about the opportunity cost of open data.
Non-commercial licenses are also an issue – organisations and scholars might feel exploited if others who have not contributed to the process of creating it can commercially publish their work. Finally, attribution is an important currency for organisations and scholars but most open licences aren't designed with that in mind.
…and the unstructured
The data that's released is often pretty unstructured. CSV files are very easy to use, so they help more people get access to information (assuming they can figure out GitHub), but a giant dump like this doesn't provide stable URIs for each object. Records in data dumps rarely link to external identifiers like the Getty's Thesaurus of Geographic Names, Art & Architecture Thesaurus (AAT) or Union List of Artist Names, or vernacular sources for place and people names such as Geonames or DBPedia. And that's fair enough, because people using a CSV file probably don't want all the hassle of dereferencing each URI to grab the place name so they can visualise data on a map (or whatever they're doing with the data). But it also means that it's hard for someone to reliably look for matching artists in their database, and link these records with data from other organisations.
So it's open, but it's often not very linked. If we're after a 'digital ecosystem of online open materials', this open data is only a baby step. But it's often where cultural organisations finish their work.
Classics > Cultural Heritage?
But many others, particularly in the classical and ancient world, have managed to overcome these issues to publish and use linked open data. So why do museums, libraries and archives seem to struggle? I'll suggest some possible reasons as conversation starters…
Not enough time
Organisations are often busy enough keeping their internal systems up and running, dealing with the needs of visitors in their physical venues, working on ecommerce and picture library systems…
Not enough skills
Cultural heritage technologists are often generalists, and apart from being too time-stretched to learn new technologies for the fun of it, they might not have the computational or information science skills necessary to implement the full linked data stack.
Some cultural heritage technologists argue that they don't know of any developers who can negotiate the complexities of SPARQL endpoints, so why publish it? The complexity is multiplied when complex data models are used with complex (or at least, unfamiliar) technologies. For some, SPARQL puts the 'end' in 'endpoint', and 'RDF triples' can seem like an abstraction too far. In these circumstances, the instruction to provide linked open data as RDF is a barrier they won't cross.
But sometimes it feels as if some heritage technologists are unnecessarily allergic to complexity. Avoiding unnecessary complexity is useful, but progress can stall if they demand that everything remains simple enough for them to feel comfortable. Some technologists might benefit from working with people more used to thinking about structured data, such as cataloguers, registrars etc. Unfortunately, linked open data falls in the gap between the technical and the informatics silos that often exist in cultural organisations.
And organisations are also not yet using triples or structured data provided by other organisations [with the exception of identifiers for e.g. people, places and specific vocabularies]. They're publishing data in broadcast mode; it's not yet a dialogue with other collections.
Not enough data
In a way, this is the collections documentation version of the technical barriers. If the data doesn't already exist, it's hard to publish. If it needs work to pull it out of different departments, or different individuals, who's going to resource that work? Similarly, collections staff are unlikely to have time to map their data to CIDOC-CRM unless there's a compelling reason to do so. (And some of the examples given might use cultural heritage collections but are a better fit with the work of researchers outside the institution than the institution's own work).
It may be easier for some types of collections than others – art collections tend to be smaller and better described; natural history collections can link into international projects for structured data, and libraries can share cataloguing data. Classicists have also been able to get a critical mass of data together. Your local records office or small museum may have more heterogeneous collections, and there are fewer widely used ontologies or vocabularies for historical collections. The nature of historical collections means that 'small ontologies, loosely joined', may be more effective, but creating these, or mapping collections to them, is still a large piece of work. While there are tools for mapping to data structures like Europeana's data model, it seems the reasons for doing so haven't been convincing enough, so far. Which brings me to…
Not enough benefits
This is an important point, and an area the community hasn't paid enough attention to in the past. Too many conversations have jumped straight to discussion about the specific standards to use, and not enough have been about the benefits for heritage audiences, scholars and organisations.
Many technologists – who are the ones making decisions about digital standards, alongside the collections people working on digitisation – are too far removed from the consumers of linked open data to see the benefits of it unless we show them real world needs.
There's a cost in producing data for others, so it needs to be linked to the mission and goals of an organisation. Organisations are not generally able to prioritise the potential, future audiences who might benefit from tools someone else creates with linked open data when they have so many immediate problems to solve first.
While some cultural and historical organisations have done good work with linked open data, the purpose can sometimes seem rather academic. Linked data is not always explained so that the average, over-worked collections or digital team will that convinced by the benefits outweigh the financial and intellectual investment.
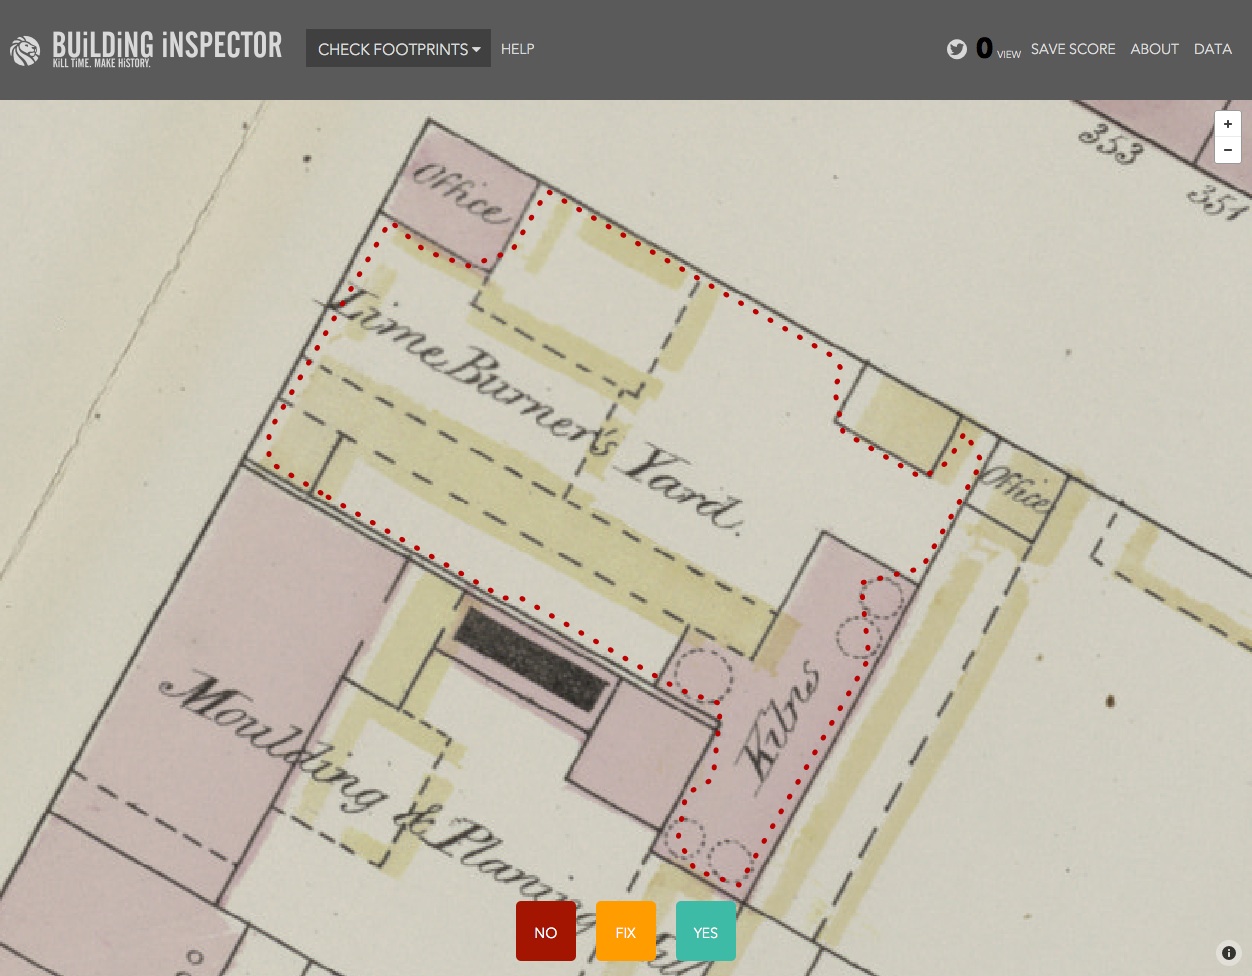
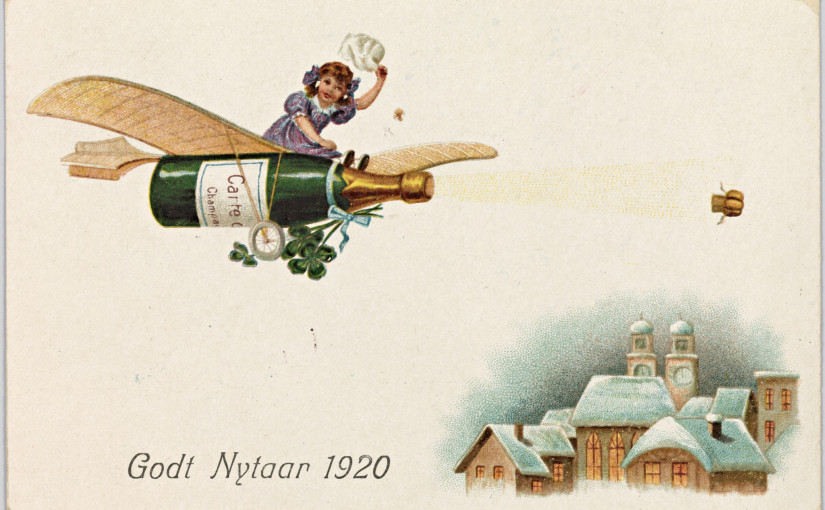
No-one's drinking their own champagne
You don't often hear of people beating on the door of a museum, library or archive asking for linked open data, and most organisations are yet to map their data to specific, widely-used vocabularies because they need to use them in their own work. If technologists in the cultural sector are isolated from people working with collections data and/or research questions, then it's hard for them to appreciate the value of linked data for research projects.
The classical world has benefited from small communities of scholar-technologists – so they're not only drinking their own champagne, they're throwing parties. Smaller, more contained collections of sources and research questions helps create stronger connections and gives people a reason to link their sources. And as we're learning throughout the day, community really helps motivate action.
(I know it's normally called 'eating your own dog food' or 'dogfooding' but I'm vegetarian, so there.)
Linked open data isn't built into collections management systems
Getting linked open data into collections management systems should mean that publishing linked data is an automatic part of sharing data online.
Chicken or the egg?
So it's all a bit 'chicken or the egg' – will it stay that way? Until there's a critical mass, probably. These conversations about linked open data in cultural heritage have been going around for years, but it also shows how far we've come.
It's all too easy to overlook international crowdsourcing projects in languages other than English so I thought I'd collect some projects related to cultural heritage, history and science here (following my definition of crowdsourcing in cultural heritage as 'asking the public to help with tasks that contribute to a shared, significant goal or research interest related to cultural heritage collections or knowledge'). This list is drawn from my PhD research, but this is a fast-moving field and I was focusing on early modern England, so inevitably this list will be missing loads of examples. Please suggest links to help people discover new projects! Also, I'm often taking my best guess at the correct translation for terms, so please correct me if I've misunderstood.
AfroCrowd is 'an outreach initiative and Wikimedia usergroup which seeks to increase awareness of the Wikimedia and free knowledge, culture, and software movements among potential editors of African descent' with links to Haitian, Igbo, Twi, Yoruba, Garifuna, French, Spanish Wikipedia and more
There's a German-language transcription project for the Digitale Edition Nachlasses Franz Brümmer and related Refine!Editor – it looks like it was designed for student participation and that interested people can register to transcribe via the contact page. Via Simone Waidmann, “Erschließung Historischer Bestände Mittels Crowdsourcing: Eine Analyse Ausgewählter Aktueller Projekte,” Perspektive Bibliothek 3, no. 1 (2014): 33–58, http://journals.ub.uni-heidelberg.de/index.php/bibliothek/article/view/14020.
ARTigo is a German project, with English, French and German-language interfaces. Tag images of artworks through six different games! They also have an active German-language blog.
Red een Portret ('Save a portrait') from the Amsterdam City Archives – help identify photographs or donate money to support the project
Ajapaik is an Estonian project asking for help identifying historical images.
Transcriptorium has several non-English datasets you can review to help train their handwriting recognition software
Ancient Lives is the site for you if you want to learn the ancient Greek alphabet while transcribing papyri.
Arthur Schnitzler digital 'is using the Transcribo software to produce a digital transcription and annotation of both typescript and manuscript material'.
You can 'use the site's comment features to share any supplements (such as citations to published works, transcription of notes not yet addressed, authorial attribution for a particular text, etc.) or remarks on the significance of the manuscript codices and contents' to help Islamic Manuscripts at Michigan.
The Norwegian The Digital Inn is for 'sources/documents digitised by institutions, associations or persons outside the organisation of the National Archives of Norway' – a fantastic way of collecting the work that community historians are doing
Estoria de Espanna and Estoria de Espanna Project blog, 'aiming to transcribe these 13th-century manuscripts, tagging them (especially for person names and toponyms) so as to reconstruct afterwards biographies and itineraries'.
Les herbonautes, a French herbarium transcription project led by the Paris Natural History Museum
Loki is a Finnish project on maritime, coastal history
Donald Sturgeon @donaldsturgeonsaid: '@chinesetextproj has an active Wiki section in which Chinese texts are transcribed/OCR post-corrected & annotated: http://ctext.org/wiki.pl?if=en'. Find out more about transcribing, proof-reading, translations, discussion and other forms of contribution on their 'Ways to Help' page.
Danish Family Search projects include indexing church, school and census records, recording street names and categorising professions.
Crowd-correction platform Kokos was 'built to improve the OCR quality of the digitized yearbooks of the Swiss Alpine Club (SAC) from the 19th century', working with French and German
j. Hocker @julianhocker said, 'take a look at interlinking.bbf.dipf.de, it is a project about a encyclopedia for children that was printed in the 19th century'
VinKo ('Varieties in Contact') is an online questionnaire developed at the Universities of Trento and Verona to gather information about the minority languages and dialects spoken in the area between Innsbruck and Verona
The French RECITAL (Contribuez librement à une expérience de transcription participative des REgistres de la Comédie-ITALienne de Paris au XVIIIe siècle). 'Ces documents uniques donnent à réviser l'état des connaissances sur l'économie du spectacle et toute l'histoire culturelle du XVIIIe. Votre aide nous est précieuse' https://recital.univ-nantes.fr/
Modern elections are data visualisation bonanzas, and the 2015 UK General Election is no exception.
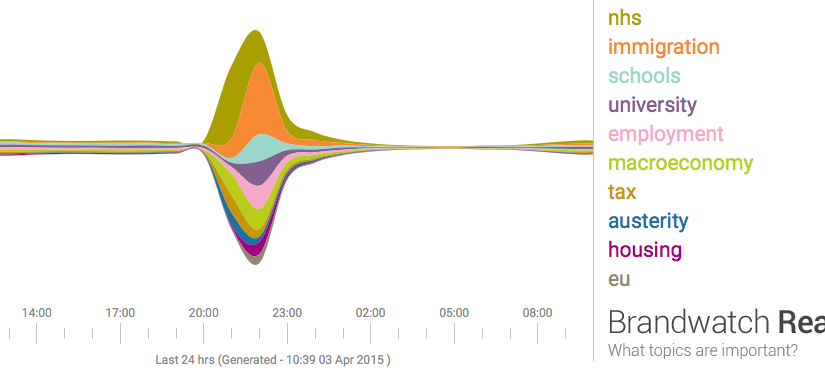
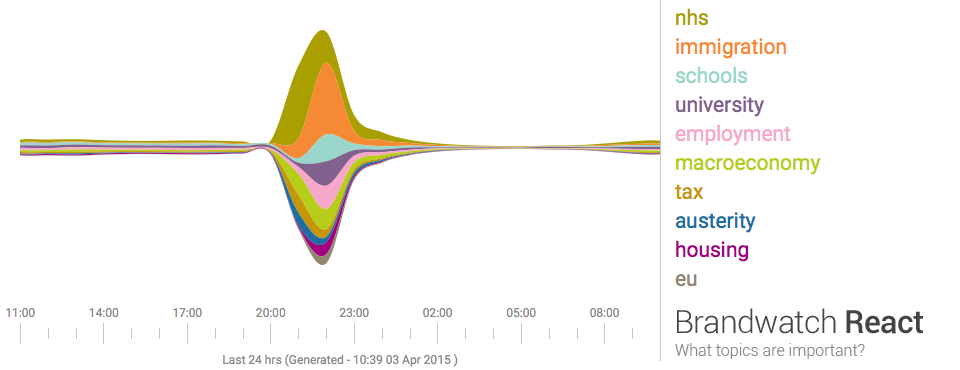
Last night seven political leaders presented their views in a televised debate. This morning the papers are full of snap polls, focus groups, body language experts, and graphs based on public social media posts describing the results. Graphs like the one below summarise masses of text using a technique called 'sentiment analysis', a form of computational language processing.* After a twitter conversation with @benosteen and @MLBrook I thought it was worth posting about the inherent biases in the tools that create these visualisations. Ultimately, 'sentiment analysis' is someone's opinion turned into code – so whose opinion are you seeing?
This is a great time to remember that sentiment analysis – mining text to see what people are talking about and how they feel about it – is based on algorithms and software libraries that were created and configured by people who've made a series of small, accumulative decisions that affect what we see. You can think of sentiment analysis as a sausage factory with the text of tweets as the mince going in one end, and pretty pictures as the product coming out the other end. A healthy democracy needs the list of secret ingredients added during processing, not least because this election prominently features spin rooms and party lines.
What are those 'ingredients'? The software used for sentiment analysis is 'trained' on existing text, and the type of text used affects what the software assumes about the world. For example, software trained on business articles is great at recognising company names but does not do so well on content taken from museum catalogues (unless the inventor of an object went on to found a company and so entered the trained vocabulary). The algorithms used to process text change the output, as does the length of the phrase analysed. The results are riddled with assumptions about tone, intent, the demographics of the poster and more.
In the case of an election, we'd also want to know when the text used for training was created, whether it looks at previous posts by the same person, and how long the software was running over the given texts. Where was the baseline of sentiment on various topics set? Who defines what 'neutral' looks like to an algorithm?
We should ask the same questions about visualisations and computational analysis that we'd ask about any document. The algorithmic 'black box' is a human construction, and just like every other text, software is written by people. Who's paying for it? What sources did they use? If it's an agency promoting their tools, do they mention the weaknesses and probable error rates or gloss over it? If it's a political party (or a company owned by someone associated with a party), have they been scrupulous in weeding out bots? Do retweets count? Are some posters weighted more heavily? Which visualisations were discarded and how did various news outlets choose the visualisations they featured? Which parties are left out?
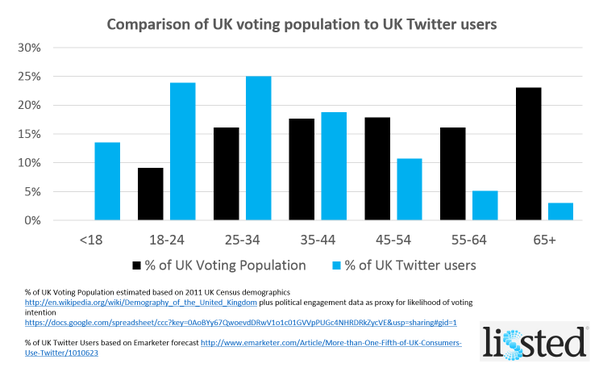
It matters because, all software has biases, and, as Brandwatch say, 'social media will have a significant role in deciding the outcome of the general election'. And finally, as always, who's not represented in the dataset?
* If you already know this, hopefully you'll know the rest too. This post is deliberately light on technical detail but feel free to add more detailed information in the comments.
I've been playing with Tate's collections data while preparing for a workshop on data visualisation. On the day I'll probably use Google Fusion Tables as an example, but I always like to be prepared so I've prepared a short exercise for creating simple graphs in Excel as an alternative.
The advantage of Excel is that you don't need to be online, your data isn't shared, and for many people, gaining additional skills in Excel might be more useful than learning the latest shiny web tool. PivotTables are incredibly useful for summarising data, so it's worth trying them even if you're not interested in visualisations. Pivot tables let you run basic functions – summing, averaging, grouping, etc – on spreadsheet data. If you've ever wanted spreadsheets to be as powerful as databases, pivot tables can help. I could create a pivot table then create a chart from it, but Excel has an option to create a pivot chart directly that'll also create a pivot table for you to see how it works.
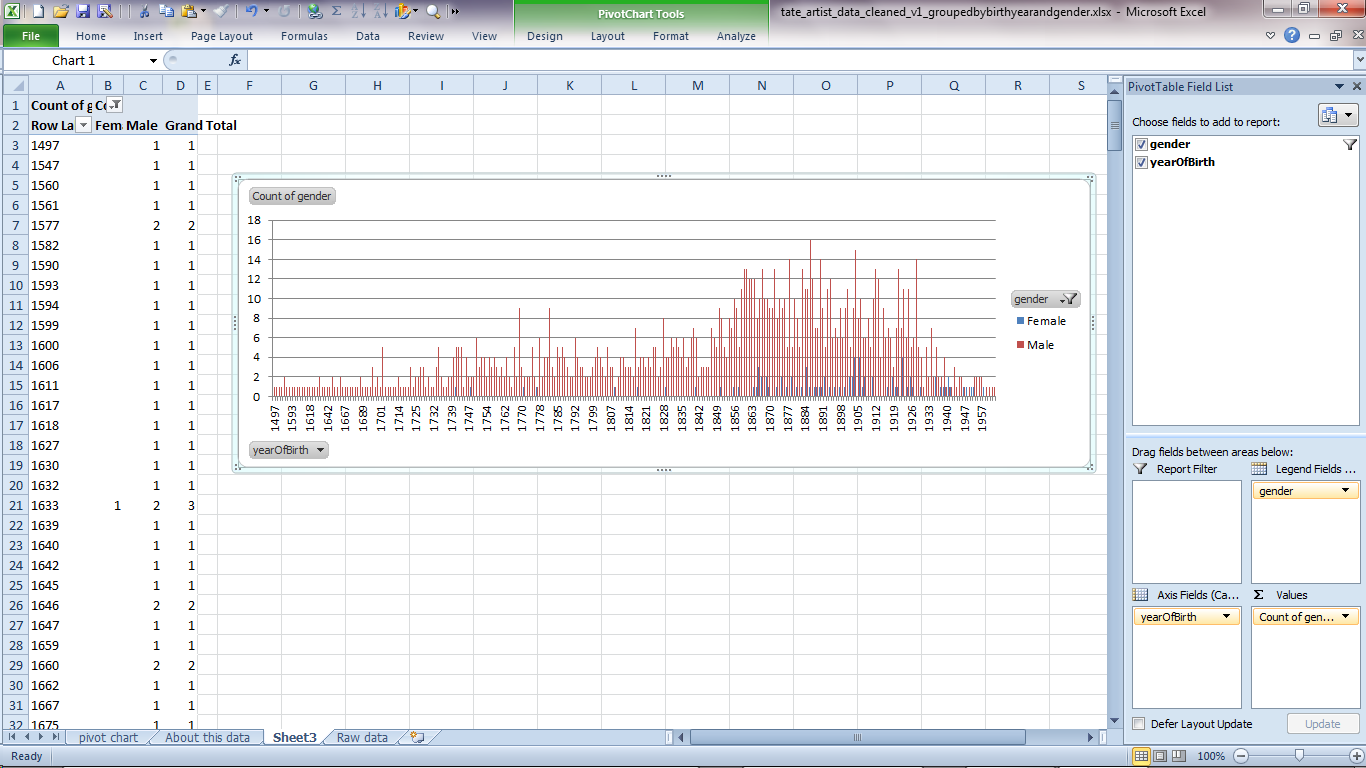
In this example, I'm interested in when the artists in Tate's collection were born, and the overall gender mix of the artists represented. To make it easier to see what's going on, I've copied those two columns of data from the original 'artists' file and copied them over to a new spreadsheet. As a row by row list of births, these columns aren't ideal for charting as they are, so I want a count of artists per year, broken down by gender.
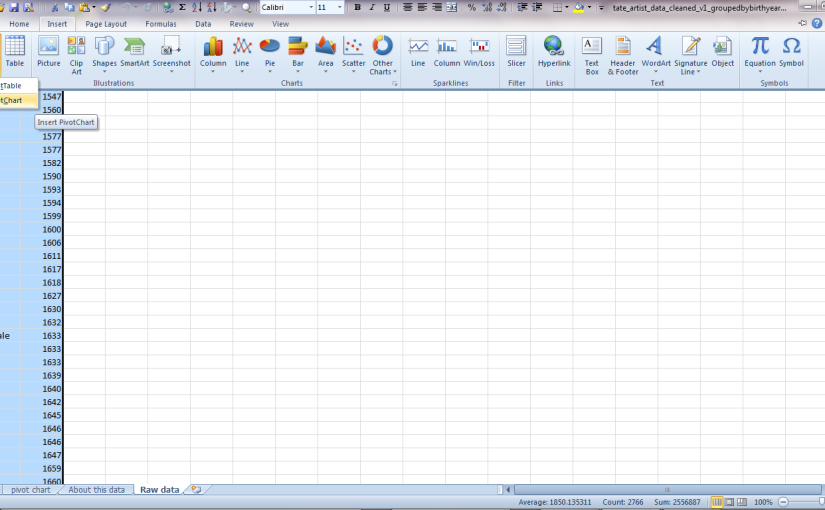
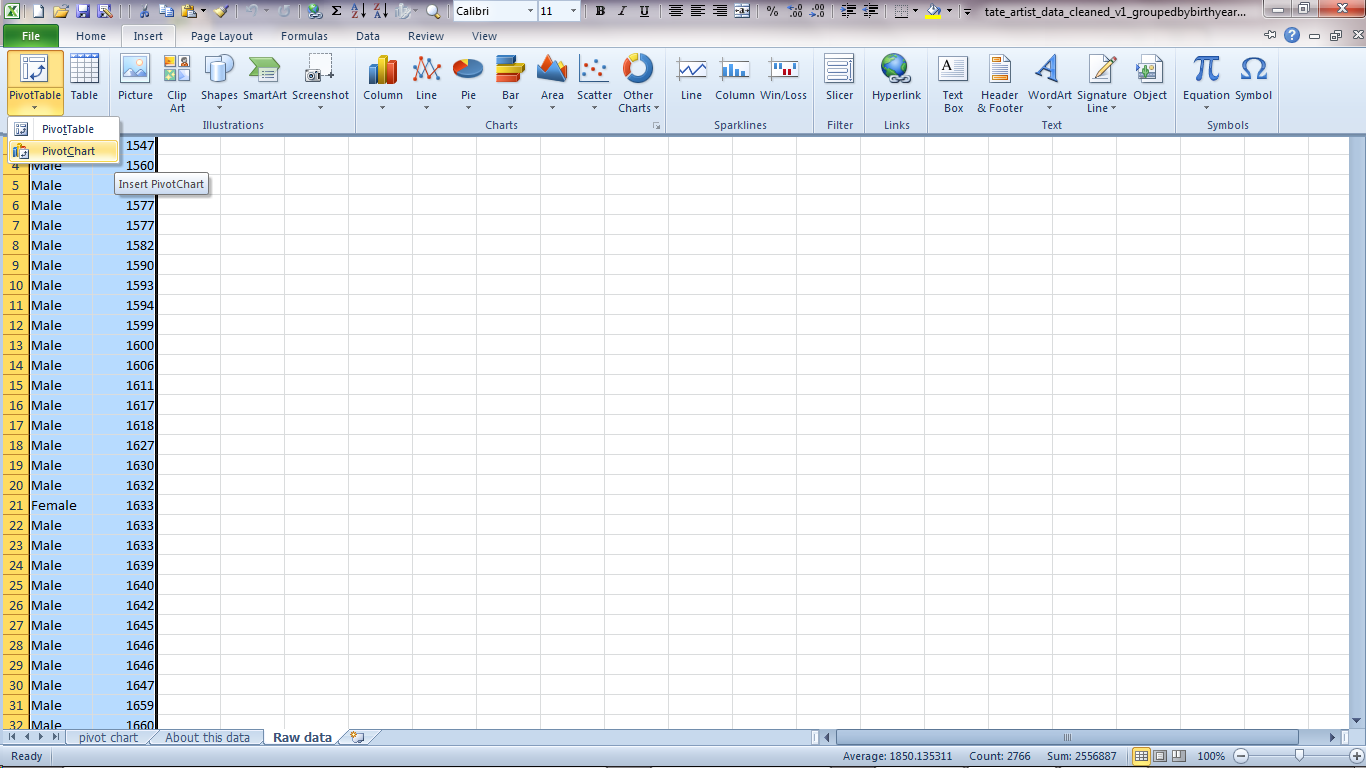
Insert PivotChart
On the 'Insert' menu, click on PivotTable to open the menu and display the option for PivotCharts.
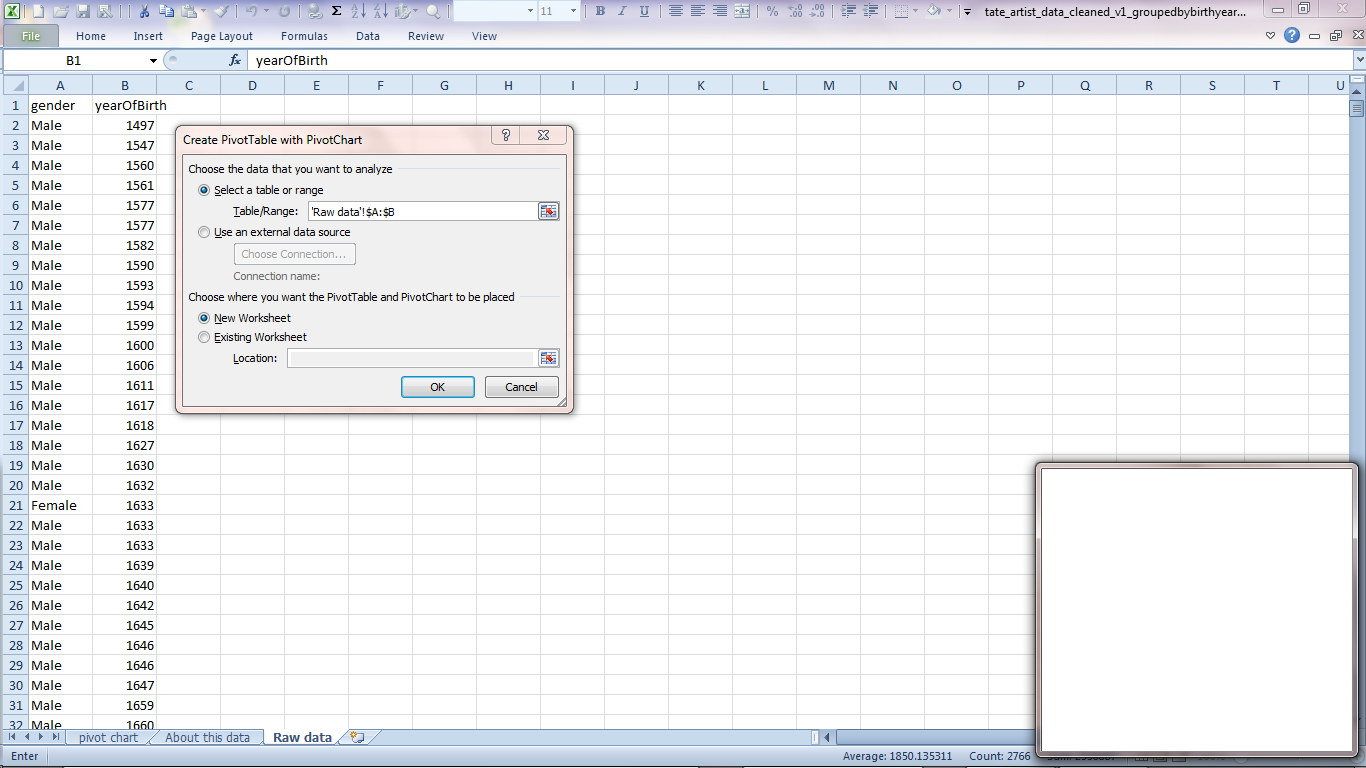
Excel will select our columns as being the most likely thing we want to chart. That all looks fine to me so click 'OK'.
Configure the PivotChart
This screen asking you to 'choose fields from the PivotTable Field List' might look scary, but we've only got two columns of data so you can't really go wrong.
The columns have already been added to the PivotTable Field List on the right, so go ahead and tick the box next to 'gender' and 'yearofBirth'. Excel will probably put them straight into the 'Axis Fields' box.
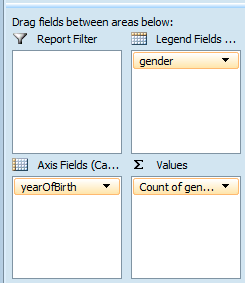
Leave yearofBirth under Axis Fields and drag 'gender' over to the 'Values' box next to it. Excel automatically turns it into 'count of gender', assuming that we want to sum the number of births per year.
The final task is to drag 'gender' down from the PivotTable Field List to 'Legend Fields' to create a key for which colours represent which gender. You should now see the pivot table representing the calculated values on the left and a graph in the middle.
Close-up of the pivot fields
When you click off the graph, the PivotTable options disappear – just click on the graph or the data again to bring them up.
You've made your first pivot chart!
You might want to drag it out a bit so the values aren't so squished. Tate's data covers about 500 years so there's a lot to fit in.
Now you've made a pivot chart, have a play – if you get into a mess you can always start again!
Colophon: the screenshots are from Excel 2010 for Windows because that's what I have.
About the data: this data was originally supplied by Tate. The full version on Tate's website includes name, date of birth, place of birth, year of death, place of death and URL on Tate's website. The latest versions of their data can be downloaded from http://www.tate.org.uk/about/our-work/digital/collection-data The source data for this file can be downloaded from https://github.com/tategallery/collection/blob/master/artist_data.csv This version was simplified so it only contains a list of years of birth and the gender of the artist. Some blank values for gender were filled in based on the artist's name or a quick web search; groups of artists or artists of unknown gender were removed as were rows without a birth year. This data was prepared in March 2015 for a British Library course on 'Data Visualisation for Analysis in Scholarly Research' by Mia Ridge.
I'd love to hear if you found this useful or have any suggestions for tweaks.
After nine years with Blogger/Blogspot, the little niggles have become too much and I've moved Open Objects over to a self-hosted WordPress blog. If you've been redirected from there, use the search box to find specific posts, check out tags or categories, or check out the 25 most popular posts (since 2008, when I added stats):