These notes were prepared for a panel discussion at the 'Always Already Computational: Collections as Data' (#AACdata) workshop, held in Santa Barbara in March 2017. While my latest thinking on the gap between the scale of collections and the quality of data about them is informed by my role in the Digital Scholarship team at the British Library, I've also drawn on work with catalogues and open cultural data at Melbourne Museum, the Museum of London, the Science Museum and various fellowships. My thanks to the organisers and the Institute of Museum and Library Services for the opportunity to attend. My position paper was called 'From libraries as patchwork to datasets as assemblages?' but in hindsight, piles and patchwork of material seemed a better analogy.
The invitation to this panel asked us to share our experience and perspective on various themes. I'm focusing on the challenges in making collections available as data, based on years of working towards open cultural data from within various museums and libraries. I've condensed my thoughts about the challenges down into the question on the slide: How do we embed the production of usable collections data into library work?
It has to be usable, because if it's not then why are we doing it? It has to be embedded because data in one-off projects gets isolated and stale. 'Production' is there because infrastructure and workflow is unsexy but necessary for access to the material that makes digital scholarship possible.
One of the biggest issues the British Library (BL) faces is scale. The BL's collections are vast – maybe 200 million items – and extremely varied. My experience shows that publishing datasets (or sharing them with aggregators) exposes the shortcomings of past cataloguing practices, making the size of the backlog all too apparent.
Good collections data (or metadata, depending on how you look at it) is necessary to avoid the overwhelmed, jumble sale feeling of using a huge aggregator like Europeana, Trove, or the DPLA, where you feel there's treasure within reach, if only you could find it. Publishing collections online often increases the number of enquiries about them – how can institution deal with enquiries at scale when they already have a cataloguing backlog? Computational methods like entity identification and extraction could complement the 'gold standard' cataloguing already in progress. If they're made widely available, these other methods might help bridge the resourcing gaps that mean it's easier to find items from richer institutions and countries than from poorer ones.
You probably already all know this, but it's worth remembering: our collections aren't even (yet) a patchwork of materials. The collections we hold, and the subset we can digitise and make available for re-use are only a tiny proportion of what once existed. Each piece was once part of something bigger, and what we have now has been shaped by cumulative practical and intellectual decisions made over decades or centuries. Digitisation projects range from tiny specialist databases to huge commercial genealogy deals, while some areas of the collections don't yet have digital catalogue records. Some items can't be digitised because they're too big, small or fragile for scanning or photography; others can't be shared because of copyright, data protection or cultural sensitivities. We need to be careful in how we label datasets so that the absences are evident.
(Here, 'data' may include various types of metadata, automatically generated OCR or handwritten text recognition transcripts, digital images, audio or video files, crowdsourced enhancements or any combination or these and more)
In addition to the incompleteness or fuzziness of catalogue data, when collections appear as data, it's often as great big lumps of things. It's hard for normal scholars to process (or just unzip) 4gb of data.
Currently, datasets are often created outside normal processes, and over time they become 'stale' as they're not updated when source collections records change. And when they manage to unzip them, the records rely on internal references – name authorities for people, places, etc – that can only be seen as strings rather than things until extra work is undertaken.
The BL's metadata team have experimented with 'researcher format' CSV exports around specific themes (eg an exhibition), and CSV is undoubtedly the most accessible format – but what we really need is the ability for people to create their own queries across catalogues, and create their own datasets from the results. (And by queries I don't mean SPARQL but rather faceted browsing or structured search forms).
Collections are huge (and resources relatively small) so we need to supplement manual cataloguing with other methods. Sometimes the work of crafting links from catalogues to external authorities and identifiers will be a machine job, with pieces sewn together at industrial speed via entity recognition tools that can pull categories out or text and images. Sometimes it's operated by a technologist who runs records through OpenRefine to find links to name authorities or Wikidata records. Sometimes it's a labour of scholarly love, with links painstakingly researched, hand-tacked together to make sure they fit before they're finally recorded in a bespoke database.
This linking work often happens outside the institution, so how can we ingest and re-use it appropriately? And if we're to take advantage of computational methods and external enhancements, then we need ways to signal which categories were applied by catalogues, which by software, by external groups, etc.
The workflow and interface adjustments required would be significant, but even more challenging would be the internal conversations and changes required before a consensus on the best way to combine the work of cataloguers and computers could emerge.
The trick is to move from a collection of pieces to pieces of a collection. Every collection item was created in and about places, and produced by and about people. They have creative, cultural, scientific and intellectual properties. There's a web of connections from each item that should be represented when they appear in datasets. These connections help make datasets more usable, turning strings of text into references to things and concepts to aid discoverability and the application of computational methods by scholars. This enables structured search across datasets – potentially linking an oral history interview with a scientist in the BL sound archive, their scientific publications in journals, annotated transcriptions of their field notebooks from a crowdsourcing project, and published biography in the legal deposit library.
A lot of this work has been done as authority files like AAT, ULAN etc are applied in cataloguing, so our attention should turn to turning local references into URIs and making the most of that investment.
Applying identifiers is hard – it takes expert care to disambiguate personal names, places, concepts, even with all the hinting that context-aware systems might be able to provide as machine learning etc techniques get better. Catalogues can't easily record possible attributions, and there's understandable reluctance to publish an imperfect record, so progress on the backlog is slow. If we're not to be held back by the need for records to be perfectly complete before they're published, then we need to design systems capable of capturing the ambiguity, fuzziness and inherent messiness of historical collections and allowing qualified descriptors for possible links to people, places etc. Then we need to explain the difference to users, so that they don't overly rely on our descriptions, making assumptions about the presence or absence of information when it's not appropriate.
A lot of what we need relies on more responsive infrastructure for workflows and cataloguing systems. For example, the BL's systems are designed around the 'deliverable unit' – the printed or bound volume, the archive box – because for centuries the reading room was where you accessed items. We now need infrastructure that makes items addressable at the manuscript, page and image level in order to make the most of the annotations and links created to shared identifiers.
(I'd love to see absorbent workflows, soaking up any related data or digital surrogates that pass through an organisation, no matter which system they reside in or originate from. We aren't yet making the most of OCRd text, let alone enhanced data from other processes, to aid discoverability or produce datasets from collections.)
Image credit: https://www.flickr.com/photos/snorski/34543357 My final thought – we can start small and iterate, which is just as well, because we need to work on understanding what users of collections data need and how they want to use them. We're making a start and there's a lot of thoughtful work behind the scenes, but maybe a bit more investment is needed from research libraries to become as comfortable with data users as they are with the readers who pass through their physical doors.
I was in London this week for the Linked Pasts event, where I presented on trends and practices for open data in cultural heritage. Linked Pasts was a colloquium on linked open data in cultural heritage organised by the Pelagios project (Leif Isaksen, Elton Barker and Rainer Simon with Pau de Soto). I really enjoyed the other papers, which included thoughtful, grounded approaches to structured data for historical periods, places and people, recognition of the importance of designing projects around audience needs (including user research), the relationship between digital tools and scholarly inquiry, visualisations as research tools, and the importance of good infrastructure for digital history.
My discussion points are based on years of conversations with other cultural heritage technologists in museums, libraries, and archives, but inevitably I'll have blind spots. For example, I'm focusing on the English-speaking world, which means I'm not discussing the great work that Dutch and Japanese organisations are doing. I've undoubtedly left out brilliant specific examples in the interests of focusing on broader trends. The point is to start conversations, to bring issues out into the open so we can collectively decide how to move forward.
The good
The good news is that more and more open cultural data is being published. Organisations have figured out that a) nothing bad is likely to happen and that b) they might get some kudos for releasing open data.
Generally, organisations are publishing the data that they have to hand – this means it's mostly collections data. This data is often as messy, incomplete and fuzzy as you'd expect from records created by many different people using many different systems over a hundred or more years.
…the bad…
Copyright restrictions mean that images mightn't be included. Furthermore, because it's often collections data, it's not necessarily rich in interpretative information. It's metadata rather than data. It doesn't capture the scholarly debates, the uncertain attributions, the biases in collecting… It certainly doesn't capture the experience of viewing the original object.
Licensing issues are still a concern. Until cultural organisations are rewarded by their funders for releasing open data, and funders free organisations from expectations for monetising data, there will be damaging uncertainty about the opportunity cost of open data.
Non-commercial licenses are also an issue – organisations and scholars might feel exploited if others who have not contributed to the process of creating it can commercially publish their work. Finally, attribution is an important currency for organisations and scholars but most open licences aren't designed with that in mind.
…and the unstructured
The data that's released is often pretty unstructured. CSV files are very easy to use, so they help more people get access to information (assuming they can figure out GitHub), but a giant dump like this doesn't provide stable URIs for each object. Records in data dumps rarely link to external identifiers like the Getty's Thesaurus of Geographic Names, Art & Architecture Thesaurus (AAT) or Union List of Artist Names, or vernacular sources for place and people names such as Geonames or DBPedia. And that's fair enough, because people using a CSV file probably don't want all the hassle of dereferencing each URI to grab the place name so they can visualise data on a map (or whatever they're doing with the data). But it also means that it's hard for someone to reliably look for matching artists in their database, and link these records with data from other organisations.
So it's open, but it's often not very linked. If we're after a 'digital ecosystem of online open materials', this open data is only a baby step. But it's often where cultural organisations finish their work.
Classics > Cultural Heritage?
But many others, particularly in the classical and ancient world, have managed to overcome these issues to publish and use linked open data. So why do museums, libraries and archives seem to struggle? I'll suggest some possible reasons as conversation starters…
Not enough time
Organisations are often busy enough keeping their internal systems up and running, dealing with the needs of visitors in their physical venues, working on ecommerce and picture library systems…
Not enough skills
Cultural heritage technologists are often generalists, and apart from being too time-stretched to learn new technologies for the fun of it, they might not have the computational or information science skills necessary to implement the full linked data stack.
Some cultural heritage technologists argue that they don't know of any developers who can negotiate the complexities of SPARQL endpoints, so why publish it? The complexity is multiplied when complex data models are used with complex (or at least, unfamiliar) technologies. For some, SPARQL puts the 'end' in 'endpoint', and 'RDF triples' can seem like an abstraction too far. In these circumstances, the instruction to provide linked open data as RDF is a barrier they won't cross.
But sometimes it feels as if some heritage technologists are unnecessarily allergic to complexity. Avoiding unnecessary complexity is useful, but progress can stall if they demand that everything remains simple enough for them to feel comfortable. Some technologists might benefit from working with people more used to thinking about structured data, such as cataloguers, registrars etc. Unfortunately, linked open data falls in the gap between the technical and the informatics silos that often exist in cultural organisations.
And organisations are also not yet using triples or structured data provided by other organisations [with the exception of identifiers for e.g. people, places and specific vocabularies]. They're publishing data in broadcast mode; it's not yet a dialogue with other collections.
Not enough data
In a way, this is the collections documentation version of the technical barriers. If the data doesn't already exist, it's hard to publish. If it needs work to pull it out of different departments, or different individuals, who's going to resource that work? Similarly, collections staff are unlikely to have time to map their data to CIDOC-CRM unless there's a compelling reason to do so. (And some of the examples given might use cultural heritage collections but are a better fit with the work of researchers outside the institution than the institution's own work).
It may be easier for some types of collections than others – art collections tend to be smaller and better described; natural history collections can link into international projects for structured data, and libraries can share cataloguing data. Classicists have also been able to get a critical mass of data together. Your local records office or small museum may have more heterogeneous collections, and there are fewer widely used ontologies or vocabularies for historical collections. The nature of historical collections means that 'small ontologies, loosely joined', may be more effective, but creating these, or mapping collections to them, is still a large piece of work. While there are tools for mapping to data structures like Europeana's data model, it seems the reasons for doing so haven't been convincing enough, so far. Which brings me to…
Not enough benefits
This is an important point, and an area the community hasn't paid enough attention to in the past. Too many conversations have jumped straight to discussion about the specific standards to use, and not enough have been about the benefits for heritage audiences, scholars and organisations.
Many technologists – who are the ones making decisions about digital standards, alongside the collections people working on digitisation – are too far removed from the consumers of linked open data to see the benefits of it unless we show them real world needs.
There's a cost in producing data for others, so it needs to be linked to the mission and goals of an organisation. Organisations are not generally able to prioritise the potential, future audiences who might benefit from tools someone else creates with linked open data when they have so many immediate problems to solve first.
While some cultural and historical organisations have done good work with linked open data, the purpose can sometimes seem rather academic. Linked data is not always explained so that the average, over-worked collections or digital team will that convinced by the benefits outweigh the financial and intellectual investment.
No-one's drinking their own champagne
You don't often hear of people beating on the door of a museum, library or archive asking for linked open data, and most organisations are yet to map their data to specific, widely-used vocabularies because they need to use them in their own work. If technologists in the cultural sector are isolated from people working with collections data and/or research questions, then it's hard for them to appreciate the value of linked data for research projects.
The classical world has benefited from small communities of scholar-technologists – so they're not only drinking their own champagne, they're throwing parties. Smaller, more contained collections of sources and research questions helps create stronger connections and gives people a reason to link their sources. And as we're learning throughout the day, community really helps motivate action.
(I know it's normally called 'eating your own dog food' or 'dogfooding' but I'm vegetarian, so there.)
Linked open data isn't built into collections management systems
Getting linked open data into collections management systems should mean that publishing linked data is an automatic part of sharing data online.
Chicken or the egg?
So it's all a bit 'chicken or the egg' – will it stay that way? Until there's a critical mass, probably. These conversations about linked open data in cultural heritage have been going around for years, but it also shows how far we've come.
I've been playing with Tate's collections data while preparing for a workshop on data visualisation. On the day I'll probably use Google Fusion Tables as an example, but I always like to be prepared so I've prepared a short exercise for creating simple graphs in Excel as an alternative.
The advantage of Excel is that you don't need to be online, your data isn't shared, and for many people, gaining additional skills in Excel might be more useful than learning the latest shiny web tool. PivotTables are incredibly useful for summarising data, so it's worth trying them even if you're not interested in visualisations. Pivot tables let you run basic functions – summing, averaging, grouping, etc – on spreadsheet data. If you've ever wanted spreadsheets to be as powerful as databases, pivot tables can help. I could create a pivot table then create a chart from it, but Excel has an option to create a pivot chart directly that'll also create a pivot table for you to see how it works.
In this example, I'm interested in when the artists in Tate's collection were born, and the overall gender mix of the artists represented. To make it easier to see what's going on, I've copied those two columns of data from the original 'artists' file and copied them over to a new spreadsheet. As a row by row list of births, these columns aren't ideal for charting as they are, so I want a count of artists per year, broken down by gender.
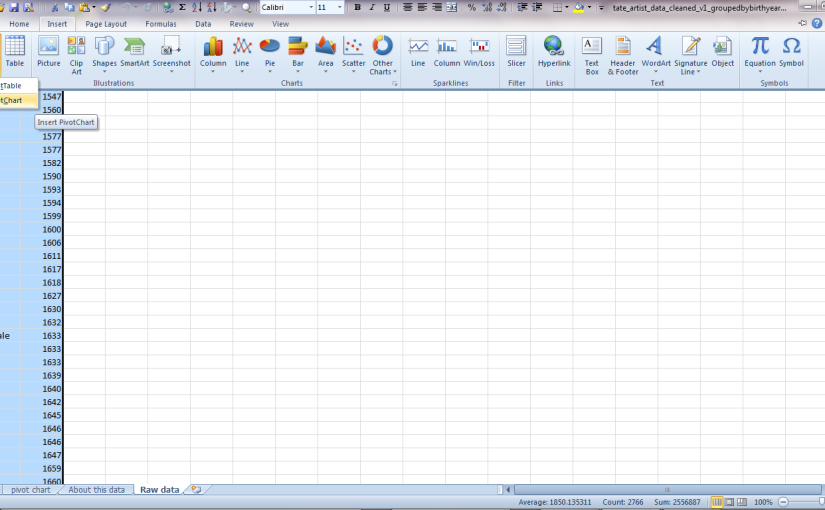
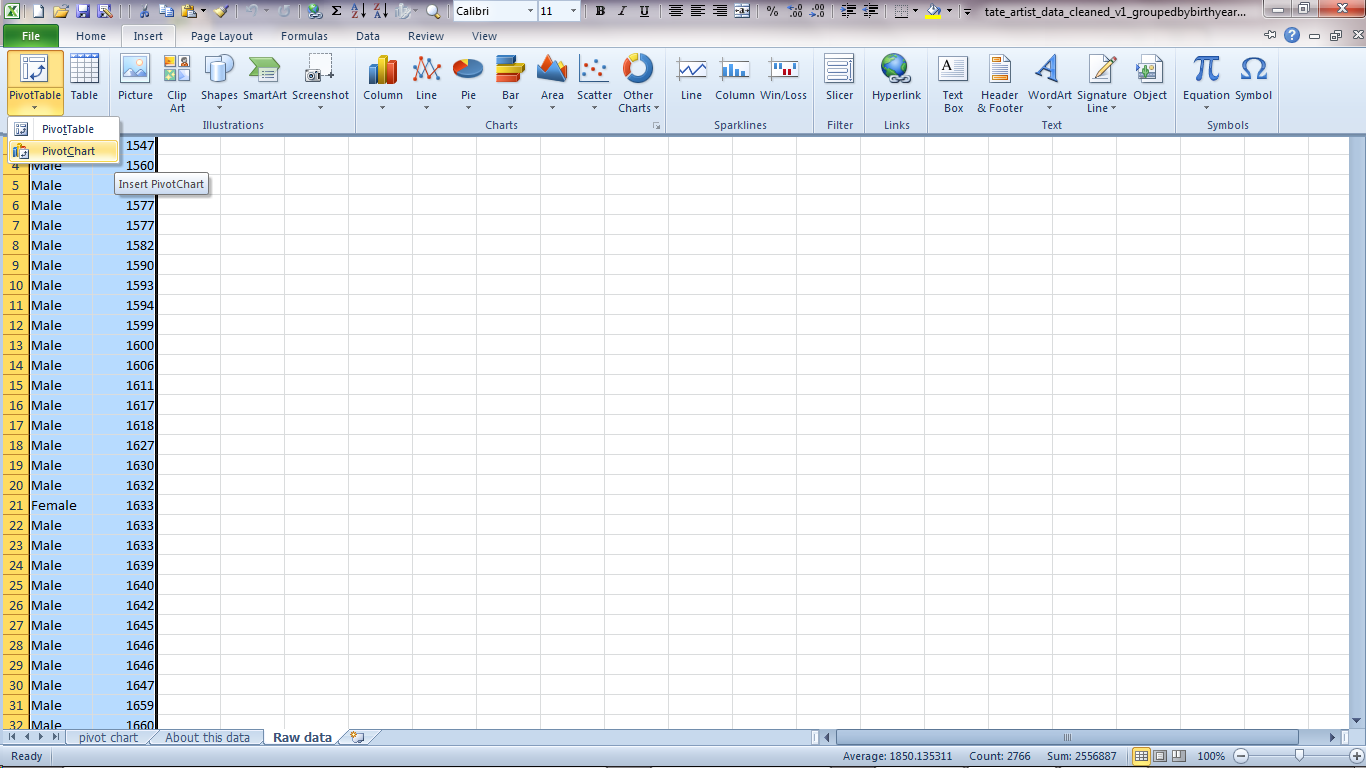
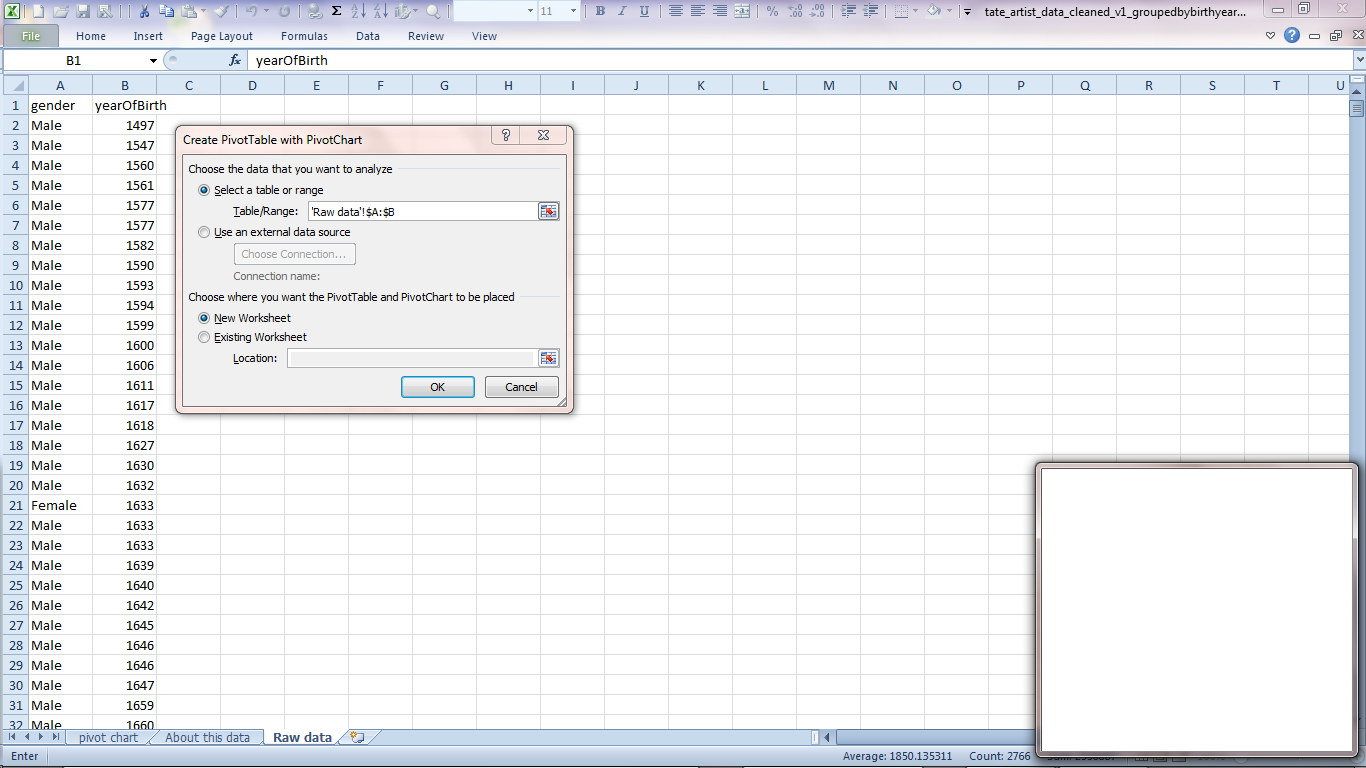
Insert PivotChart
On the 'Insert' menu, click on PivotTable to open the menu and display the option for PivotCharts.
Excel will select our columns as being the most likely thing we want to chart. That all looks fine to me so click 'OK'.
Configure the PivotChart
This screen asking you to 'choose fields from the PivotTable Field List' might look scary, but we've only got two columns of data so you can't really go wrong.
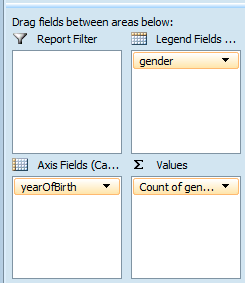
The columns have already been added to the PivotTable Field List on the right, so go ahead and tick the box next to 'gender' and 'yearofBirth'. Excel will probably put them straight into the 'Axis Fields' box.
Leave yearofBirth under Axis Fields and drag 'gender' over to the 'Values' box next to it. Excel automatically turns it into 'count of gender', assuming that we want to sum the number of births per year.
The final task is to drag 'gender' down from the PivotTable Field List to 'Legend Fields' to create a key for which colours represent which gender. You should now see the pivot table representing the calculated values on the left and a graph in the middle.
Close-up of the pivot fields
When you click off the graph, the PivotTable options disappear – just click on the graph or the data again to bring them up.
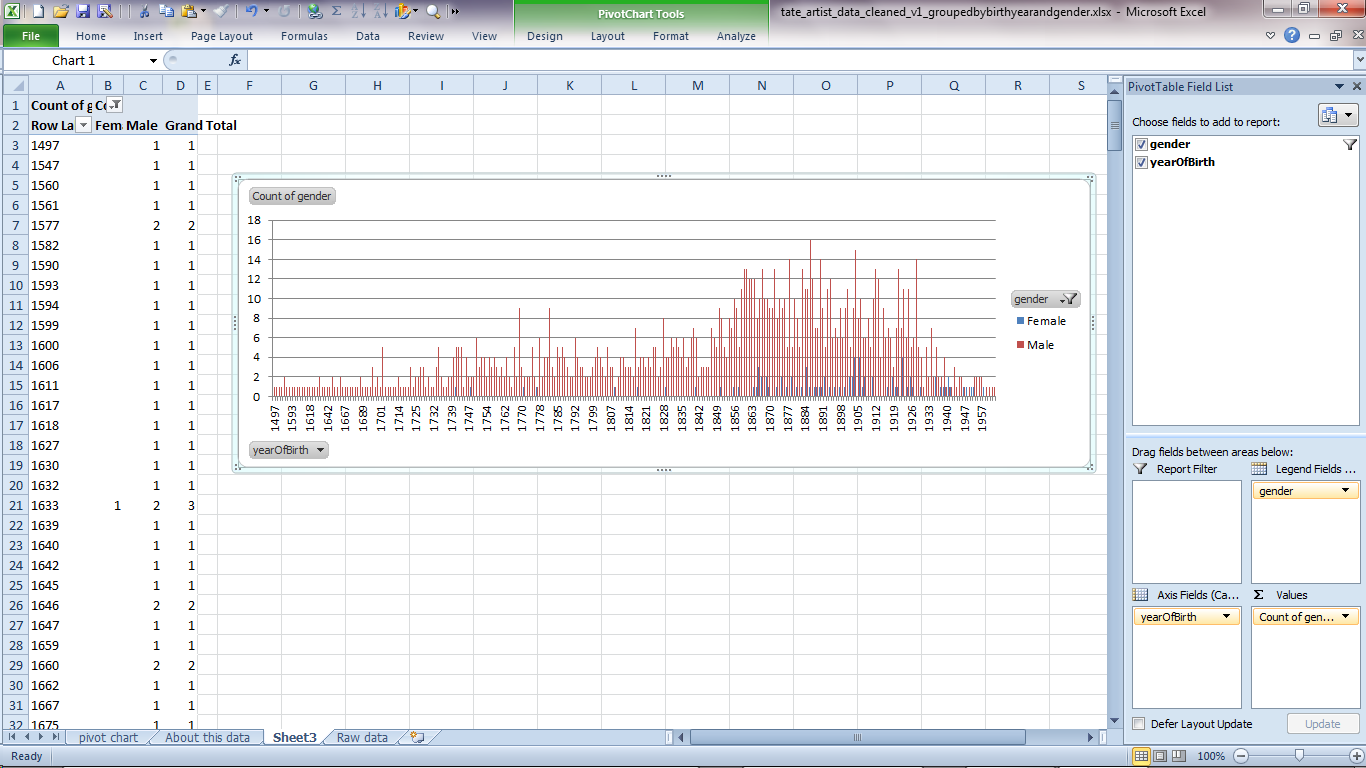
You've made your first pivot chart!
You might want to drag it out a bit so the values aren't so squished. Tate's data covers about 500 years so there's a lot to fit in.
Now you've made a pivot chart, have a play – if you get into a mess you can always start again!
Colophon: the screenshots are from Excel 2010 for Windows because that's what I have.
About the data: this data was originally supplied by Tate. The full version on Tate's website includes name, date of birth, place of birth, year of death, place of death and URL on Tate's website. The latest versions of their data can be downloaded from http://www.tate.org.uk/about/our-work/digital/collection-data The source data for this file can be downloaded from https://github.com/tategallery/collection/blob/master/artist_data.csv This version was simplified so it only contains a list of years of birth and the gender of the artist. Some blank values for gender were filled in based on the artist's name or a quick web search; groups of artists or artists of unknown gender were removed as were rows without a birth year. This data was prepared in March 2015 for a British Library course on 'Data Visualisation for Analysis in Scholarly Research' by Mia Ridge.
I'd love to hear if you found this useful or have any suggestions for tweaks.
I originally posted this on the Science Museum API documentation wiki.
About this data
These data sets contain information about objects from the collections of the Science Museum, the National Media Museum and the National Railway Museum. These datasets include many items not on display in our galleries, as well as authority records about related people and organisations, events and image files.
The collections include objects relating to aeronautics, agriculture, astronomy, cinematography, medicine, materials, space, television, time measurement, transport and more. They range in size from contact lenses to Concorde 002.
We hope to publish our lists of c9000 people and organisations related to these objects soon, alongside a table linking objects to events.
The data is supplied in CSV (comma-separated format, exported from Excel). The first line of each file contains the field headings. Files may be up to 15mb in size.
The data is released under the Creative Commons Attribution-NonCommercial-ShareAlike (CC BY-NC-SA) licence (http://creativecommons.org/licenses/by-nc-sa/3.0/). Please contact us if you would like to use this data under different conditions.
Why we're releasing the data
We have been providing access to a searchable database of our collections online at http://collectionsonline.nmsi.ac.uk/ for some time now, but through staff attendance at various hack days, we've learned that this interface does not support programmatic search or exploration of the data. We've also learned (through the Cosmos & Culture project) that a number of people found the XML provided by the default .Net service that published the API too complex. CSV is a very simple format, accessible to a wider range of people. We hope that it will be usable by most people.
We're publishing the data in CSV format now as a relatively lightweight experiment. We'd like to understand whether, and if so, how, people would use our data. We'd also like to explore the benefits for the museum and for programmers using our data – your feedback would inform decisions about future investment in more structured data as well as helping shape our understanding of the requirements of those users.
We hope you will be creative with it, but please use it responsibly. If you're not sure whether the museum would be comfortable with your idea, please drop us a line to discuss it.
How you can help
You can help us to improve this resource – let us know if you have any information about our objects, or if you find any errors, though we will probably not republish this data set in the short-term. Please quote the Object Number/s and email: Collections.Online@nmsi.ac.uk
We'd like this experiment to help us understand the needs of potential users but we can only do that with your help – we'd love to hear your comments on how you've used the data, and how we could improve it. If possible, we'd like to feature mashups or other applications made with our data. Please email us at web.team@nmsi.ac.uk, send @sciencemuseum a message on twitter or leave a comment at http://sciencemuseumdiscovery.com/blogs/museumdev.
The unique identifier for a record, based on the museum's own accession number. The number may refer to a single object or (historically) to a collection of objects.
ITEM_NAME
Object name – a simple name or common name. Where possible this is from an established thesaurus (i.e. http://museum-api.pbworks.com/f/NMSI_draft200903_object_name.csv)
TITLE
A short one-line caption or brief description of the object, derived from the existing data. The title should be a summary capturing the essence of an object. Often includes related place and date.
MAKER
The name of the person or company or other organisation that made the object. The Maker field is indexed and linked to the People/Organisation records (to be released shortly) – links should be made by matching strings (internal IDs are not available).
DATE_MADE
The date when an object was made (production date). Dates should be recorded consistently and ranges should be in the format <earlier year>-<later year> e.g. 1671-1700. Approximate dates are written as e.g. c. 1936. This field also contains various strings, including ‘Unknown'.
PLACE_MADE
Place names are indexed in the database and linked into a hierarchy (Getty Thesaurus of Geographic Names with in-house modifications i.e. http://museum-api.pbworks.com/f/NMSI_draft200903_place.csv) and should be recorded consistently because they are derived from a term list. Where known with certainty or reasonable probability the town or city of production is recorded. As a minimum the nation/country of origin or the probable nation/country of production should be recorded. If there is some uncertainty this can be explained in the general description.
MATERIALS
Records what the object is made of and what part of the object is made of that material.
MEASUREMENTS
Record the type of measurements that are most useful for an object, with ‘overall' being the most usual dimensions recorded. Overall will be the amount of space the object takes up when it first arrives in the museum and is stored. Measurements must be recorded consistently in metric units. Compulsory measurements are Size and Weight. The default units of measurement are millimetres and kilograms. Example: overall: 51 mm x 95 mm x 80 mm, 0.371kg,
DESCRIPTION
In this field we try to describe what the what, when, why, where, who information about the object, what it is, what it does, is made of, who made it, where was it made and what makes it unique. This field should be exported as plain text (without markup). The information here is used by the museum to audit an object so it should be described well with each part defined. It should also contain all the information about the object so that an interpreted description can be written (suitable for publication). Technical terms have been avoided as far as possible. Names, dates, places and significant events should be recorded here in a normalized form but will also be recorded in other indexed fields. As far as possible the following are recorded: <number of objects> <name of object, qualifier> <model name, number> <what is the type of object?> <specific information>:<made by…> <type of object> <place made> <date made> <any associated relevant fact> <materials> <colour><serial number><containers> <accessories> <dimensions> <condition and completeness> <identification of parts> <acquisition/provenance information> <story of display, conservation etc.> <other details>
WHOLE_PART
Mostly an internal field.
COLLECTION
A broad subject specialism applied during the Acquisition/ Entry process. NMeM National Media Museum NRM National Railway Museum SCM Science Museum. Collection terms are listed at http://museum-api.pbworks.com/w/page/36515349/NMSI-Collections-list
For more information on authority records, see http://en.wikipedia.org/wiki/Authority_control
You can use it to construct URLs to images of the objects. (The images are hosted on a site built with a third-party solution so the URLs aren't ideal.)
objects.ID_NUMBER is the equivalent to media. OBJECT, giving you a link between the object and media tables (e.g. 1999-719). The media. MEDIAKEY (e.g. 125972) can then be included in a URL, e.g. the image file URL uses the media key: http://collectionsonline.nmsi.ac.uk/grabimg.php?wm=1&kv=125972
Column title
What is it?
MEDIA_ID
e.g. 10327065.jpg
OBJECT
The object ID_NUMBER e.g. 1999-719
MEDIAKEY
e.g. 125972
CAPTION
Optional. E.g. ‘Class 84 locomotive at Barrow Hill, sanding and filling in progress, August 1984'
Currently this data set has fairly random coverage but we would be interested to see whether people find the content useful. If the object was linked to any significant event (historical, political, developmental or other milestone events) or if an object featured at some significant and well-known event or activity, it might be recorded in this table.
Column title
What is it?
Event Name
Includes location and date/date range.
Event Short Name
Event title without location or date (usually)
Event Category
Values include era, war, exhibition, expedition (term list?)
Occurrence Type
E.g. one-time, periodic, annual. Optional
Event Start Date
Single date as year or y/m/d. Mixed formats (sorry!). Also includes BCE dates expressed as negative integers e.g. -3100 Optional
Event End Date
As for Event Start Date. Optional
Display Date
?
Duration
Integer – use with Duration Unit. Optional
Duration Unit
E.g. days, months, years. Use with Duration. Optional
Event Description
Text. Optional
Description Source(s)
May be a URL. Optional
Sort Name
Internal use version of event name
Produced for the Science Museum, London. Last updated by Mia Ridge, March 2011. With thanks to the web, database and documentation teams at NMSI for their support and assistance. Thanks also to @rboulton for testing the documentation.
I originally posted this on the Science Museum API wiki. This version dates to March 2011, as I documented things before leaving to do a PhD.
Documentation for collections data from Science Museum, National Media Museum, National Railway Museum (NMSI) released as CSV
About this data
These data sets contain information about objects from the collections of the Science Museum, the National Media Museum and the National Railway Museum. These datasets include many items not on display in our galleries, as well as authority records about related people and organisations, events and image files.
The collections include objects relating to aeronautics, agriculture, astronomy, cinematography, medicine, materials, space, television, time measurement, transport and more. They range in size from contact lenses to Concorde 002.
We hope to publish our lists of c9000 people and organisations related to these objects soon, alongside a table linking objects to events.
The data is supplied in CSV (comma-separated format, exported from Excel). The first line of each file contains the field headings. Files may be up to 15mb in size.
The data is released under the Creative Commons Attribution-NonCommercial-ShareAlike (CC BY-NC-SA) licence (http://creativecommons.org/licenses/by-nc-sa/3.0/). Please contact us if you would like to use this data under different conditions.
Why we're releasing the data
We have been providing access to a searchable database of our collections online at http://collectionsonline.nmsi.ac.uk/ for some time now, but through staff attendance at various hack days, we've learned that this interface does not support programmatic search or exploration of the data. We've also learned (through the Cosmos & Culture project) that a number of people found the XML provided by the default .Net service that published the API too complex. CSV is a very simple format, accessible to a wider range of people. We hope that it will be usable by most people.
We're publishing the data in CSV format now as a relatively lightweight experiment. We'd like to understand whether, and if so, how, people would use our data. We'd also like to explore the benefits for the museum and for programmers using our data – your feedback would inform decisions about future investment in more structured data as well as helping shape our understanding of the requirements of those users.
We hope you will be creative with it, but please use it responsibly. If you're not sure whether the museum would be comfortable with your idea, please drop us a line to discuss it.
How you can help
You can help us to improve this resource – let us know if you have any information about our objects, or if you find any errors, though we will probably not republish this data set in the short-term. Please quote the Object Number/s and email: Collections.Online@nmsi.ac.uk
We'd like this experiment to help us understand the needs of potential users but we can only do that with your help – we'd love to hear your comments on how you've used the data, and how we could improve it. If possible, we'd like to feature mashups or other applications made with our data. Please email us at web.team@nmsi.ac.uk, send @sciencemuseum a message on twitter or leave a comment at http://sciencemuseumdiscovery.com/blogs/museumdev.
The unique identifier for a record, based on the museum's own accession number. The number may refer to a single object or (historically) to a collection of objects.
ITEM_NAME
Object name – a simple name or common name. Where possible this is from an established thesaurus (i.e. http://museum-api.pbworks.com/f/NMSI_draft200903_object_name.csv)
TITLE
A short one-line caption or brief description of the object, derived from the existing data. The title should be a summary capturing the essence of an object. Often includes related place and date.
MAKER
The name of the person or company or other organisation that made the object. The Maker field is indexed and linked to the People/Organisation records (to be released shortly) – links should be made by matching strings (internal IDs are not available).
DATE_MADE
The date when an object was made (production date). Dates should be recorded consistently and ranges should be in the format <earlier year>-<later year> e.g. 1671-1700. Approximate dates are written as e.g. c. 1936. This field also contains various strings, including ‘Unknown'.
PLACE_MADE
Place names are indexed in the database and linked into a hierarchy (Getty Thesaurus of Geographic Names with in-house modifications i.e. http://museum-api.pbworks.com/f/NMSI_draft200903_place.csv) and should be recorded consistently because they are derived from a term list. Where known with certainty or reasonable probability the town or city of production is recorded. As a minimum the nation/country of origin or the probable nation/country of production should be recorded. If there is some uncertainty this can be explained in the general description.
MATERIALS
Records what the object is made of and what part of the object is made of that material.
MEASUREMENTS
Record the type of measurements that are most useful for an object, with ‘overall' being the most usual dimensions recorded. Overall will be the amount of space the object takes up when it first arrives in the museum and is stored. Measurements must be recorded consistently in metric units. Compulsory measurements are Size and Weight. The default units of measurement are millimetres and kilograms. Example: overall: 51 mm x 95 mm x 80 mm, 0.371kg,
DESCRIPTION
In this field we try to describe what the what, when, why, where, who information about the object, what it is, what it does, is made of, who made it, where was it made and what makes it unique. This field should be exported as plain text (without markup). The information here is used by the museum to audit an object so it should be described well with each part defined. It should also contain all the information about the object so that an interpreted description can be written (suitable for publication). Technical terms have been avoided as far as possible. Names, dates, places and significant events should be recorded here in a normalized form but will also be recorded in other indexed fields. As far as possible the following are recorded: <number of objects> <name of object, qualifier> <model name, number> <what is the type of object?> <specific information>:<made by…> <type of object> <place made> <date made> <any associated relevant fact> <materials> <colour><serial number><containers> <accessories> <dimensions> <condition and completeness> <identification of parts> <acquisition/provenance information> <story of display, conservation etc.> <other details>
WHOLE_PART
Mostly an internal field.
COLLECTION
A broad subject specialism applied during the Acquisition/ Entry process. NMeM National Media Museum NRM National Railway Museum SCM Science Museum. Collection terms are listed at http://museum-api.pbworks.com/w/page/36515349/NMSI-Collections-list
For more information on authority records, see http://en.wikipedia.org/wiki/Authority_control
You can use it to construct URLs to images of the objects. (The images are hosted on a site built with a third-party solution so the URLs aren't ideal.)
objects.ID_NUMBER is the equivalent to media. OBJECT, giving you a link between the object and media tables (e.g. 1999-719). The media. MEDIAKEY (e.g. 125972) can then be included in a URL, e.g. the image file URL uses the media key: http://collectionsonline.nmsi.ac.uk/grabimg.php?wm=1&kv=125972
Column title
What is it?
MEDIA_ID
e.g. 10327065.jpg
OBJECT
The object ID_NUMBER e.g. 1999-719
MEDIAKEY
e.g. 125972
CAPTION
Optional. E.g. ‘Class 84 locomotive at Barrow Hill, sanding and filling in progress, August 1984'
Currently this data set has fairly random coverage but we would be interested to see whether people find the content useful. If the object was linked to any significant event (historical, political, developmental or other milestone events) or if an object featured at some significant and well-known event or activity, it might be recorded in this table.
Column title
What is it?
Event Name
Includes location and date/date range.
Event Short Name
Event title without location or date (usually)
Event Category
Values include era, war, exhibition, expedition (term list?)
Occurrence Type
E.g. one-time, periodic, annual. Optional
Event Start Date
Single date as year or y/m/d. Mixed formats (sorry!). Also includes BCE dates expressed as negative integers e.g. -3100 Optional
Event End Date
As for Event Start Date. Optional
Display Date
?
Duration
Integer – use with Duration Unit. Optional
Duration Unit
E.g. days, months, years. Use with Duration. Optional
Event Description
Text. Optional
Description Source(s)
May be a URL. Optional
Sort Name
Internal use version of event name
Produced for the Science Museum, London. Last updated by Mia Ridge, March 2011. With thanks to the web, database and documentation teams at NMSI for their support and assistance. Thanks also to @rboulton for testing the documentation.
I originally posted this on the Science Museum API wiki in 2008, this version dates from about March 2011 (when I left the Science Museum Group to start a PhD).
I’m very excited about sharing this with you – we’ve just released 218,822 records about objects from the collections of the Science Museum, the National Media Museum and the National Railway Museum.
The collections include objects relating to aeronautics, agriculture, astronomy, cinematography, medicine, materials, space, television, time measurement, transport and more. They range in size from contact lenses to Concorde 002.
We’ve released the files as a lightweight experiment – we’d like to understand whether, and if so, how, people would use our data. We’d also like to explore the benefits for the museum and for programmers using our data – your feedback will inform decisions about future investment in more structured data as well as helping shape our understanding of the requirements of those users. The files are in CSV format – because it’s a really simple format, viewable in a text editor, we hope that it will be usable by most people.
Culture Hack Day (#chd11) was organised by the Royal Opera House (the team being @rachelcoldicutt, @katybeale, @beyongolia, @mildlydiverting, @dracos – and congratulations to them all on an excellent event). As well as a hack event running over two days, they had a session of five minute 'lightning talks' on Saturday, with generous time for discussion between sessions. This worked quite well for providing an entry point to the event for the non-technical, and some interesting discussion resulted from it. My notes are particularly rough this time as I have one arm in a sling and typing my hand-written notes is slow.
Lightning Talks Tom Uglow @tomux “What if the Web is a Fad?”
'We're good at managing data but not yet good at turning it into things that are more than points of data.' The future is about physical world, making things real and touchable.
Clare Reddington, @clarered, “What if We Forget about Screens and Make Real Things?”
Some ace examples of real things: Dream Director; Nuage Vert (Helsinki power station projected power consumption of city onto smoke from station – changed people's behaviour through ambient augmentation of the city); Tweeture (a conch, 'permission object' designed to get people looking up from their screens, start conversations); National Vending Machine from Dutch museum.
Leila Johnston, @finalbullet talked about why the world is already fun, and looking at the world with fresh eyes. Chromaroma made Oyster cards into toys, playing with our digital footprint.
Discussion kicked off by Simon Jenkins about helping people get it (benefits of open data etc) – CR – it's about organisational change, fears about transparency, directors don't come to events like this. Understand what's meant by value – cultural and social as well as economic. Don't forget audiences, it has to be meaningful for the people we're making it (cultural products) for'.
Comment from @fidotheCultural heritage orgs have been screwed over by software companies. There's a disconnect between beautiful hacks around the edges and things that make people's lives easier. [Yes! People who work in cultural heritage orgs often have to deal with clunky tools, difficult or vendor-dependent data export proccesses, agencies that over-promise and under-deliver. In my experience, cultural orgs don't usually have internal skills for scoping and procuring software or selecting agencies so of course they get screwed over.]
TU: desire to be tangible is becoming more prevalent, data to enhance human experience, the relationship between culture and the way we live our lives.
Tom Armitage, @infovore “Sod big data and mashups: why not hack on making art?”
Making culture is more important than using it. 3 trends: 1) collection – tools to slice and dice across time or themes; 2) magic materials 3) mechanical art, displays the shape of the original content; 3a) satire – @kanyejordan 'a joke so good a machine could make it'.
Tom Dunbar, @willyouhelp – story-telling possibilites of metadata embedded in media e.g. video [check out Waisda? for game designed to get metdata added to audio-visual archives]. Metadata could be actors, characters, props, action…
Discussion [?]:remixing in itself isn't always interesting. Skillful appropriation across formats… Universe of editors, filterers, not only creators. 'in editing you end up making new things'.
Matthew Somerville, @dracos, Theatricalia, “What if You Never Needed to Miss a Show?”
'Quite selfish', makes things he needs. Wants not to miss theatre productions with people he likes in/working on them. Theatricalia also collects stories about productions. [But in discussion it came up that the National Theatre asked him to remove data – why?! A recommendation system would definitely get me seeing more theatre, and I say that as a fairly regular but uninformed theatre-goer who relies on word-of-mouth to decide where to spend ticket money.]
Nick Harkaway, @Harkaway on IP and privacy
IP as way of ringfencing intangible ideas, requiing consent to use. Privacy is the same. Not exciting, kind of annoying but need to find ways to make it work more smoothly while still proving protection. 'Buying is voting', if you buy from Tesco, you are endorsing their policies. 'Code for the change you want to see in the world', build the tools you want cultural orgs to have so they can do better. [Update: Nick has posted his own notes at Notes from Culture Hack Day. I really liked the way he brought ethical considerations to hack enthusiasm for pushing the boundaries of what's possible – the ability to say 'no' is important even if a pain for others.]
Chris Thorpe, @jaggeree. ArtFinder, “What if you could see through the walls of every museum and something could tell you if you’d like it?”
Culture for people who don't know much about culture. Cultural buildings obscure the content inside, stop people being surprised by what's available. It's hard if you don't know where to start. Go for user-centric information. Government Art Collection Explorer – ace! Wants an angel for art galleries to whisper information about the art in his ear. Wants people to look at the art, not the screen of their device [museums also have this concern]. SAP – situated audio platform. Wants a 'flight data recorder' for trips around cultural places.
Discussion around causes of fear and resistance to open data – what do cultural orgs fear and how can they learn more and relax? Fear of loss of provenance – response was that for developers displaying provenance alongside the data gives it credibility; counter-response was that organisations don't realise that's possible. [My view is that the easiest way to get this to change is to change the metrics by which cultural heritage organisations are judged, and resolve the tension between demands to commercialise content to supplement government grants and demands for open access to that same data. Many museums have developed hybrid 'free tombstone, low-res, paid-for high-res' models to deal with this, but it's taken years of negotiation in each institution.] I also ranted about some of these issues at OpenTech 2010, notes at 'Museums meet the 21st century'.
Other discussion and notes from twitter – re soap/drama characters tweeting – I managed to out myself as a Neighbours watcher but it was worth it to share that Neighbours characters tweet and use Facebook. Facebook relationship status updates and events have been included as plot points, and references are made to twitter but not to the accounts of the characters active on the service. I wonder if it's script writers or marketing people who write the characters tweets? They also tweet in sync with the Australian showings, which raises issues around spoilers and international viewers.
Someone said 'people don't want to interact with cultural institutions online. They want to interact with their content' but I think that's really dependent on the definition of content – as pointed out, points of data have limited utility without further context. There's a catch-22 between cultural orgs not yet making really engaging data and audiences not yet demanding it, hopefully hack days like CHD11 help bridge the gap and turn data into stories and other meaningful content. We're coming up against the limits of what can be dome programmatically, especially given variation in quality and extent of cultural heritage data (and most of it is data rather than content).
After the lightning talks I popped over the road to check out the hacking and ended up getting sucked in (the lure of free pizza had a powerful effect!). I worked on a WordPress plugin with Ian Ibbotson @ianibbo that lets you search for a term on the Culture Grid repository and imports the resulting objects into my museum metadata games so that you can play with objects based on your favourite topic. I've put the code on github [https://github.com/mialondon/mmg-import] and will move it from my staging server to live over the next few days so people can play with the objects. It's such a pain only having one hand, and I'm very grateful to Ian for the chance to work together and actually get some code written. This work means that any organisation that's contributed records to the Culture Grid can start to get back tags or facts to enhance their collections, based on data generated by people playing the games. The current 300-ish objects have about 4400 tags and 30 facts, so that's not bad for a freebie. OTOH, I don't know of many museums with the ability to display content created by others on their collections pages or store it in their collections management systems – something for another hack day?
Something I think I'll play around with a bit more is the idea of giving cultural heritage data a quality rating as it's ingested. We discussed whether the ratings would be local to an app (as they could be based on the particular requirements of that application) or generalised and recorded in the CultureGrid service. You could record the provence of a rating which might be an approach that combines the benefits of both approaches. At the moment, my requirements for a 'high quality' record would be: title (e.g. 'The Ashes trophy', if the object has one), name or type of object (e.g. cup), date, place, decent sized image, description.
Finally, if you're interested in hacking around cultural heritage data, there's also historyhackday next weekend. I'm hoping to pop in (dependent on fracture and MSc dissertation), not least because in March I'm starting a PhD in digital humanities, looking at participatory digitisation of geo-located historical material (i.e. getting people to share the transcriptions and other snippets of ad hoc digitisation they do as part of their research) and it's all hugely relevant.
This is a lazy post, a straight copy and paste of my presentation notes (my excuse is that I'm eight days behind on everything at work and uni after being grounded in the US by volcanic ash). Anyway, I hope you enjoy it or that it's useful in some way.
The Cosmic Collections project was based on a simple idea – what if we gave people the ability to make their own collection website? The Science Museum was planning an exhibition on astronomy and culture, to be called ‘Cosmos & Culture’. We had limited time and resources to produce a site to support the exhibition and we risked creating ‘just another exhibition microsite’. So what if we provided access to the machine-readable exhibition content that was already being gathered internally, and threw it open to the public to make websites with it? And what if we motivated them to enter by offering competition prizes? Competition participants could win a prize and kudos, and museum audiences might get a much more interesting, innovative site.
The idea was a good match for museum mission, exhibition content, technical context, hopefully audience – but was that enough?
Slide 2 (satellite dish):
Questions…
If we built an API, would anyone use it?
Can you really crowdsource the creation of collections interfaces?
The project gave me a chance to investigate some specific questions. At the time, there were lots of calls from some quarters for museums to produce APIs for each project, but would anyone actually use a museum API? The competition might help us understand whether or how we should invest in APIs and machine-readable data.
We can never build interfaces to meet the needs of every type of audience. One of the promises of machine-readable data is that anyone can make something with your data, allowing people with particular needs to create something that supports their own requirements or combines their data with ours – but would anyone actually do it?
Slide 3 (map mashup):
Mashups combine data from one or more sources and/or data and visualisation tools such as maps or timelines.
I'm going to get the geek stuff out of the way and quickly define mashups and APIs…
Mashups are computer applications that take existing information from known sources and present it to the viewer in a new way. Here’s a mashup of content edits from Wikipedia with a map showing the location of the edit.
Slide 4 (APIs)
APIs (Application Programming Interfaces) are a way for one machine to talk to another: ‘Hi Bob, I’d like a list of objects from you, and hey, Alice, could you draw me a timeline to put the objects on?’
APIs tell a computer, 'if you go here, you will get that information, presented like this, and you can do that with it'.
A way of providing re-usable content to the public, other museums and other departments within our museum – we created a shared backend for web and gallery interactives.
I think of APIs as user interfaces for developers and wanted to design a good experience for developers with the same care you would for end users*. I hoped that feedback from the competition could be used to improve the beta API
* we didn’t succeed in the first go but it’s something to aim for post-beta
Slide 5: (what if nobody came?)
AKA 'the fears and how to deal with them'
Acknowledge those fears
Plan for the worst case scenario
Take a deep breath and do it anyway
And on the next slides, the results. If I was replicating the real experience, you’d have several nerve-biting months while you waited for the museum to lumber into gear, planned the launch event, publicised the project in the participant communities… Then waited for results to come in. But let’s skip that bit…
The results – our judges declared a winner and a runner-up, these are screenshots – this is the second prize winning entry.
People came to the party. Yay! I'd like to thank all the participants, whether they submitted a final entry or not. It wouldn't have worked without them.
Slide 7: (Natalie and Simon's http://cosmos.natimon.com/)
This is a screenshot from the winning site – it made the best use of the API and was designed to lure the visitor in and keep drawing them through the site.
(We didn’t get subject specialists scratching their own itch – maybe they don’t need to share their work, maybe we didn’t reach them. Would like to reach researchers, let them know we have resources to be used, also that they can help us/our audiences by sharing their work)
Slide 8: (astrolabe – what did we learn?)
People need (more) help to participate in a geektastic project like this
The dynamics of a competition are tricky
Mashups are shaped by the data provided – you get out what you put in
Can we help people bring their own content to a future mashup?
Slide 9: (evaluation)
I did a small survey to evaluate the project… Turns out the project was excellent outreach into the developer community. People were really excited about being invited to play with our data. My favourite quote: "The very idea of the competition was awesome"
Slide 10: (paper sheet)
Also positive coverage in technical press. So in conclusion?
Slide 11: (Tim Berners-Lee):
“The thing people are amazed about with the web is that, when you put something online, you don’t know who is going to use it—but it does get used.”
There are a lot of opportunities and excitement around putting machine-readable data online…
Slide 12: Tim Berners-Lee 2:
But: It doesn’t happen automatically; It’s not a magic bullet
But people won't find and use your APIs without some encouragement. You need to support your API users. People outside the museum bring new ideas but there's still a big role for people who really understand the data and audiences to help make it a quality experience…
Slide 13 (space):
What next?
Using the feedback to focus and improve collection-wide API
Adding other forms of machine-readable data
Connecting with data from your collections?
I've been thinking about how to improve APIs – offer subject authorities with links to collections, embed markup in the collections pages to help search engines understand our data…
I want more! The more of us with machine-readable data available for re-use, the better the cross-collections searches, the region or specialism-wide mashups… I'd love to be able to put together a mashup showing all the cultural heritage content about my suburb; all the Boucher self-portraits; all the inventions that helped make the Space Shuttle work…
Slide 14: (thank you)
If you're interested in possibilities of machine-readable data and access to your collections, join in the conversation on the museum API wiki or follow along on twitter or on blogs. Join in at http://museum-api.pbworks.com/
I’m particularly interested in finding the balance between a solution we can achieve in the medium-term and something that works with standards as much as possible.
It’s nearly time for the Museums and the Web 2010 conference, where questions like this might be addressed in one of the unconference sessions so I’d love to hear your thoughts.
This is very much a work in progress, and in fact I suspect it's not even the latest version, but hopefully at least it's more useful up here than on my hard drive, even in a very draft-ish state.
February, 2010.
This is a thoughts-in-development piece on how the Science Museum/NMSI could provide re-usable, interoperable, structured machine-readable data for use as linked data or APIs.
I'm including here things that we generally have enough information about for it to make sense for us to link them. I'll talk about ways to link to the rest of the world below.
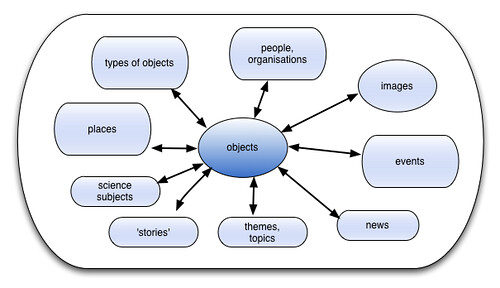
Objects – we have lots of these. Yay! Each record is about a specific accessioned object. As you can see from the diagram above, objects can be related to everything else (and to each other, in various ways). An object might be as big and iconic as Robert Stephenson's Rocket or as small as a spark plug.
Types of objects – a more generic view. It allows us to solve two problems – our collections don't cover everything we want to talk about, and we have lots and lots of certain types of objects. So a page on spark plugs is a user-friendly layer of content about spark plugs for general readers and provides links to all 8000 spark plugs in the collection (I totally made that number up).
It lets us discuss topics that our collections don't cover comprehensively, and to create a user-friendly layer between the detail of our collection (8000 spark plugs) and general information about spark plugs.
[If you're not familiar with museum collections – coverage varies according to what was collectable or collected – our collections may represent fashions in history of collecting more than an ideal uber-collection. Unlike, say, an art gallery, not every single item in our collection is a precious and unique diamond – for the general user, it might be enough to know what we have some information about dental forceps and a picture of one – but for the specialist researcher, browsing our collection of 300 of them might be the highlight of their week. (Maybe).]
Places – in our collections databases, we can look at the place an object was made, used, designed, destroyed, collected, restored, redesigned, invented, etc, etc. People and events also have various possible relationships to places.
People/organisations – ideally, we'd like to Wikipedia for every person and place, but not everyone we refer to in our collections has Wikipedia notability.
Images – we also have lots of related images, which are a major asset but work better in relation to other things (like objects) than as concepts on their own.
Other hooks in our content include dates and materials – these might be particularly useful for facetted browsing or mashups made with our data, but don't particularly make sense as concepts on their own. We also produce contemporary science news through our (re-opening in June) Antenna gallery, and marking this up with hNews seems a no-brainer. Working out how to link to the original news stories, whether in Nature, the BBC, whatever, would be good – something we can build into the publishing platform (WordPress MU) to make it nice and easy for our content authors would be even better.
Linking concepts and microsites, creating a canonical object home
I'm proposing a model that should allow us to make the most of all the data we've got online already as well as designing around concepts.
[see notes below for some background]
As well as 'objects' as a basic concept, museums come with a handy set of stable concepts built into our collections management systems. Sometimes these are called 'subject authorities'. They cover things like people and organisations, places, events and the relationships between them. We often build various interpretative narrative layers on top of them – themes, topics, stories, whatever.
If we build permanent URIs around those concepts, we can link to them from the existing microsites. We can also wrap metadata around the elements already on the pages of those microsites so that the data is meaningfully machine-accessible in situ.
As an example, we'd have http://sciencemuseum.org.uk/objects/1956-152 as the 'home page' for the Pilot ACE computer in our collection. This page would contain the basic 'tombstone' information – when, where, what, etc, and link to every known instance of the object in other sites, as below. These other sites might be exhibitions, subject-specialist sites, cross-institution collections. Often they'll contain information written specifically for that site, particularly tailored for its scope and audiences.
This object is represented in various microsites. The image below shows up we might mark up those sites with links to our Science Museum concepts:
The object home page could also link to the Pilot Ace page on Ingenious and on our Centenary site, and they could link back to the object home. They could also link to our Alan Turing page, National Physical Laboratory page, etc.
It'd be great if we could link to other content about that object – this BBC article on Pilot ACE is a pointer to more content.
Vocabularies
This is one of the places I get stuck… Do we go general or specific? There's lots of stuff out there for visual resources but that doesn't describe our collections well. There's some discussion of this on various pages here, including Authority Lists, Implementation formats, and RDFa (the names get out of control fairly quickly!).
Notes on URIs
Some of our accession numbers are going to make things difficult because they contain '/'.
On Wednesday [you can tell how long ago I started this because that was February 24] I went to the second London Linked Data meetup, held during dev8D.
For a while I've been wondering what we (Science Museum/NMSI) could do with linked data, but it's also taken a while for the issues to bubble up.
The first two issues are data standards and vocabulary. As the saying goes, 'the good thing about standards is that there are so many to choose from'. http://museum-api.pbworks.com/Implementation-formats and http://museum-api.pbworks.com/RDFa bear witness to the difficulties of… finding out what developers prefer to work with (if they care at all), finding out what other museums can output to try and get some critical mass going…
The third is machine-readable interface design. Tom Scott [Apis and APIs] advocates building APIs so that you're linking people to the concepts that matter to them, and making your website your API. I think this is the right way to go, but it's made trickier by the fact that we're not a greenfield site – we've got exhibition microsites that are over ten years old. We're gradually migrating all that data into a central repository, but it'd be good if we could make the data already online in those sites re-usable too.
Other earlier notes… When designing the Cosmic Collections API last year, I'd considered building it into the 'human-facing' website architecture, so that a device could request XML or JSON versions of the pages alongside the (X)HTML pages. In the end I went for a standalone API as an interim solution. The Cosmic Collections competition was designed in part to answer some of my questions about the formats preferred by developers.
Comments on the Science Museum linked data wiki page
This made me realise I've also completely missed out 'exhibitions' as a concept – we do cover this for current exhibitions to an extent, but there's a lot of information hidden in the choices made for previous exhibitions that could be useful. It also contributes to really making the object home the definitive resource.
And another comment – can you tell I should be doing something else today? It's all about constructive procrastination.
Richard Morgan from across the road at the V&A commented (http://twitter.com/rmorg/status/10831225400), 'linked data vocabularies tricky for me too. For V&A I'm tending towards just geo, foaf and dbpedia – more about links than data' which I think is a useful perspective. There is a level at which the precise application of term lists matters, but if it means we spend the next ten years trying to get it perfect rather than doing something now, I'd rather we did something now. The two aren't mutually exclusive technically, but pragmatically I only have limited time/brain space in which to get something done.
Mia, hi… I think you'll need to model both real-world objects and web documents as part of this. So, for example… for any particular artefact, say the lunar lander, you have the thing itself (a real-world object which is assigned one URI) and the description of that thing (a Web document which is assigned a different URI).
To get from the 'object' URI to the 'description' URI requires an HTTP 303 redirect response (unless you choose to use hash URIs).
The 'description' URI can offer multiple representations, e.g. HTML with embedded RDFa and RDF/XML.
I like your list of "URIs and concepts we could model" and the idea of how the web page about an object in the collection can be linked to relevant people, places, images etc.
There's a lot of scope for this approach to help people to explore the collection from different perspectives and via different dimensions.
Vocabularies: this is an area where it makes sense to re-use existing work where possible, but if there is nothing out there that fits your purpose, don't be afraid to invent a new specialist vocabulary of your own. It's easy (and normal practice) to 'mix and match' terms from multiple vocabularies/ontologies as required.
Thanks for your really useful comments, Bill. I've been horribly busy preparing for a conference next week but will respond properly when my feet are back on the ground!
Try to keep in mind that an important reason for publishing the museums artifacts, whether real or digital, is to enable data about them to be "meshed" with other data (from the museum and from elsewhere) and republished, possibly in unanticipated ways, and the "mashed" applications that are created from those datasets. So the answer to whether you are doing it "correctly" will depend on the feedback you get!
The most important thing for you to do is ensure that you make it easy for your community of users to provide you with feedback, wiki a wiki or whatever. Make sure this is obvious and easy, AND that you adapt as they provide that feedback!
You might consider using OpenVocab http://open.vocab.org/ as a means for your community to add new terms.
There's already a great authoritative reference for places: GeoNames Ontology http://www.geonames.org/ontology/ "over 6.2 million geonames toponyms now have a unique URL with a corresponding RDF web service"
I think we can add a point that a RESTful web services (esp. based on simple common standards like Atom) can be useful for bridging between more "Plain Web" design approaches and linked data approaches. Here's a<a href='http://www.alexandriaarchive.org/blog/?p=497'> paper</a> I gave at the Computer Applications in Archaeology conference about this issue.
OK. Try this again, since HTML doesn't work in the comments.
Great discussion of the linked data issues.
I think we can add a point that a RESTful web services (esp. based on simple common standards like Atom) can be useful for bridging between more "Plain Web" design approaches and linked data approaches. Here's a(http://www.alexandriaarchive.org/blog/?p=497) I gave at the Computer Applications in Archaeology conference about this issue.
These thoughts are my own "take homes" from the discussion, rather than any sense of the meeting's overall conclusions.
What data do museums have?
Database content, mostly fielded and designed mainly for collections management support. Textual materials, much of it in a non-accessible "grey literature" format. Images.
The database content is typically (reasonably) self-consistent within a given environment. Thus we have known properties (from the field name) with usable string values. The challenge from a Linked Data perspective is the cost-effective generation of URLs from the string values currently held, e.g. for people and places, given that different museums will have different vocabularies to control their content.
Who wants to use this data?
The public, who are typically interested in classes of objects (rather than individual objects), or in objects with certain properties (e.g. coming from a place of interest to them). Educators, or more specifically people who create resources for educators to use. Students, if relevant objects could be easily accessed as "follow up" to formal learning materials.
Notes on 7 July 2010 meetup (part 2) How do we improve the data?
There is nothing to stop every museum publishing URLs, and whatever associated Linked Data they have to hand, for each object in their own collection, and thereby giving them a "hook" onto which others can hang added-value information and assertions of their own. They should treat this task as an urgent priority.
Where possible, convert string values in data to URLs, ideally widely-used (not just local) ones. Could use e.g. geonames.org for place names, or dbpedia for object class names. Interest in Portsmouth's historical gazetteer for "old" place names.
There is a clear need for a sector-specific ontology which represents the properties found, i.e. the types of information recorded in museum databases. This will act as the "predicate" in Linked Data triples/assertions. It could be based on an existing agreement about these semantics, e.g. CIDOC CRM or LIDO.
Axis-based data such as geographical co-ordinates or dates/date ranges could be treated as purely numerical data, or "pixellated" by assigning a URL which imposes a certain level of precision (e.g. year for dates). Or both approaches could be adopted.
What's the museum take on Linked Data?
Simple assertions are not enough; we care about the attribution of those assertions (i.e. who is making the assertion). We also want a framework which allows the expression of uncertainty and doubt.
We are not particularly bothered about the specific format (RDF/XML, RDFa, JSON, Topic Maps) in which Linked Data is published, but we would like to be able to "do the job once" and have done with it.
Thanks for the minutes Richard – seems like it was a really interesting discussion – shame I couldn't be there – particularly as we've been working with the author of CIDOC to start mapping our data! Look forward to the next meeting. Josh
I been wondering about identifiers, pref. UUID types this sort of fits in where you have [insert museum-y discussion of the exceptions] in your doc. given we have loads of object numbers full of illegal characters (for both file systems and URIs) I thought the concept of MuseumID may be very helpful as we moved toward linked data.. http://museumid.net/about
 These notes were prepared for a panel discussion at the 'Always Already Computational: Collections as Data' (#AACdata) workshop, held in Santa Barbara in March 2017. While my latest thinking on the gap between the scale of collections and the quality of data about them is informed by my role in the Digital Scholarship team at the British Library, I've also drawn on work with catalogues and open cultural data at Melbourne Museum, the Museum of London, the Science Museum and various fellowships. My thanks to the organisers and the Institute of Museum and Library Services for the opportunity to attend. My position paper was called 'From libraries as patchwork to datasets as assemblages?' but in hindsight, piles and patchwork of material seemed a better analogy.
 You probably already all know this, but it's worth remembering: our collections aren't even (yet) a patchwork of materials. The collections we hold, and the subset we can digitise and make available for re-use are only a tiny proportion of what once existed. Each piece was once part of something bigger, and what we have now has been shaped by cumulative practical and intellectual decisions made over decades or centuries. Digitisation projects range from tiny specialist databases to huge commercial genealogy deals, while some areas of the collections don't yet have digital catalogue records. Some items can't be digitised because they're too big, small or fragile for scanning or photography; others can't be shared because of copyright, data protection or cultural sensitivities. We need to be careful in how we label datasets so that the absences are evident.
 In addition to the incompleteness or fuzziness of catalogue data, when collections appear as data, it's often as great big lumps of things. It's hard for normal scholars to process (or just unzip) 4gb of data.
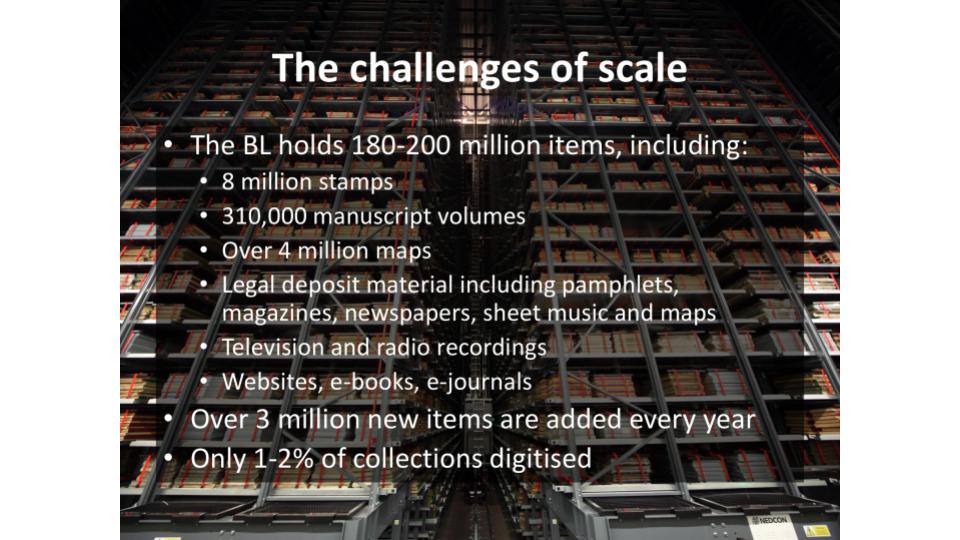 Collections are huge (and resources relatively small) so we need to supplement manual cataloguing with other methods. Sometimes the work of crafting links from catalogues to external authorities and identifiers will be a machine job, with pieces sewn together at industrial speed via entity recognition tools that can pull categories out or text and images. Sometimes it's operated by a technologist who runs records through OpenRefine to find links to name authorities or Wikidata records. Sometimes it's a labour of scholarly love, with links painstakingly researched, hand-tacked together to make sure they fit before they're finally recorded in a bespoke database.
 The trick is to move from a collection of pieces to pieces of a collection. Every collection item was created in and about places, and produced by and about people. They have creative, cultural, scientific and intellectual properties. There's a web of connections from each item that should be represented when they appear in datasets. These connections help make datasets more usable, turning strings of text into references to things and concepts to aid discoverability and the application of computational methods by scholars. This enables structured search across datasets – potentially linking an oral history interview with a scientist in the BL sound archive, their scientific publications in journals, annotated transcriptions of their field notebooks from a crowdsourcing project, and published biography in the legal deposit library.
 A lot of what we need relies on more responsive infrastructure for workflows and cataloguing systems. For example, the BL's systems are designed around the 'deliverable unit' – the printed or bound volume, the archive box – because for centuries the reading room was where you accessed items. We now need infrastructure that makes items addressable at the manuscript, page and image level in order to make the most of the annotations and links created to shared identifiers.
 My final thought – we can start small and iterate, which is just as well, because we need to work on understanding what users of collections data need and how they want to use them. We're making a start and there's a lot of thoughtful work behind the scenes, but maybe a bit more investment is needed from research libraries to become as comfortable with data users as they are with the readers who pass through their physical doors.