 These notes were prepared for a panel discussion at the 'Always Already Computational: Collections as Data' (#AACdata) workshop, held in Santa Barbara in March 2017. While my latest thinking on the gap between the scale of collections and the quality of data about them is informed by my role in the Digital Scholarship team at the British Library, I've also drawn on work with catalogues and open cultural data at Melbourne Museum, the Museum of London, the Science Museum and various fellowships. My thanks to the organisers and the Institute of Museum and Library Services for the opportunity to attend. My position paper was called 'From libraries as patchwork to datasets as assemblages?' but in hindsight, piles and patchwork of material seemed a better analogy.
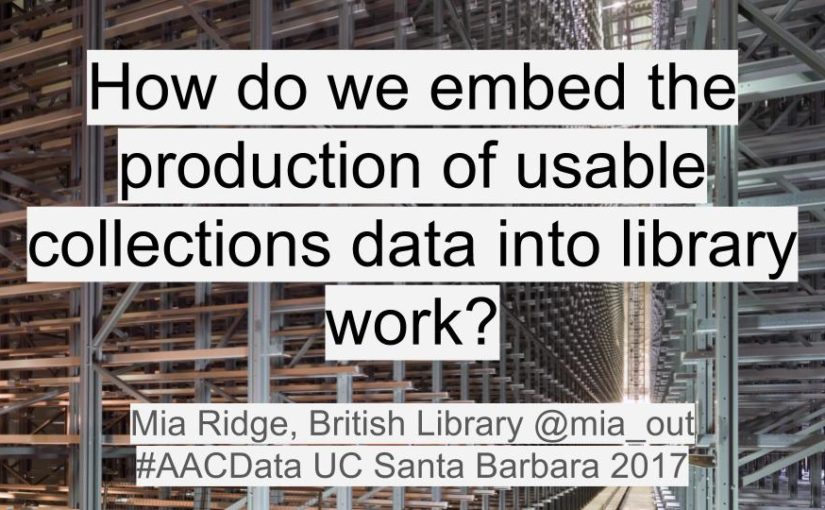
The invitation to this panel asked us to share our experience and perspective on various themes. I'm focusing on the challenges in making collections available as data, based on years of working towards open cultural data from within various museums and libraries. I've condensed my thoughts about the challenges down into the question on the slide: How do we embed the production of usable collections data into library work?
It has to be usable, because if it's not then why are we doing it? It has to be embedded because data in one-off projects gets isolated and stale. 'Production' is there because infrastructure and workflow is unsexy but necessary for access to the material that makes digital scholarship possible.
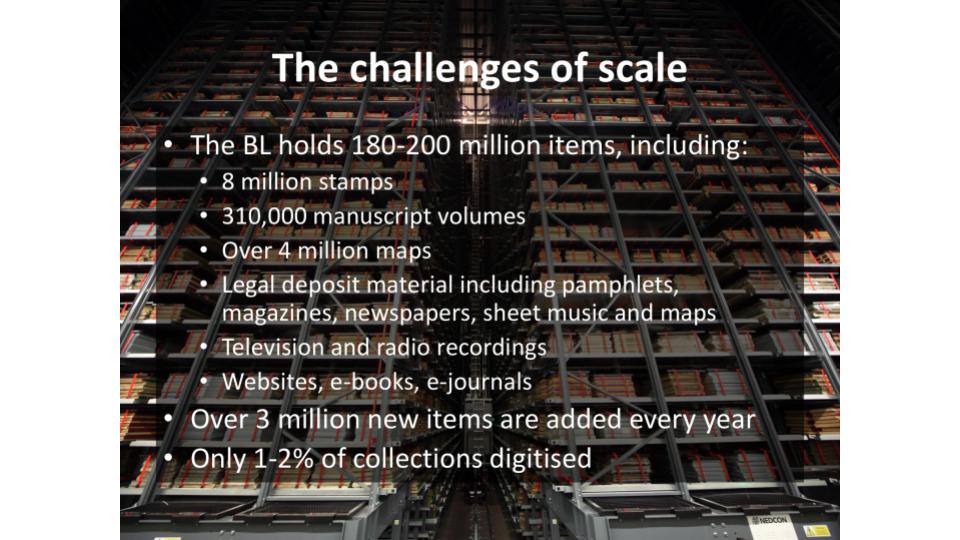
One of the biggest issues the British Library (BL) faces is scale. The BL's collections are vast – maybe 200 million items – and extremely varied. My experience shows that publishing datasets (or sharing them with aggregators) exposes the shortcomings of past cataloguing practices, making the size of the backlog all too apparent.
Good collections data (or metadata, depending on how you look at it) is necessary to avoid the overwhelmed, jumble sale feeling of using a huge aggregator like Europeana, Trove, or the DPLA, where you feel there's treasure within reach, if only you could find it. Publishing collections online often increases the number of enquiries about them – how can institution deal with enquiries at scale when they already have a cataloguing backlog? Computational methods like entity identification and extraction could complement the 'gold standard' cataloguing already in progress. If they're made widely available, these other methods might help bridge the resourcing gaps that mean it's easier to find items from richer institutions and countries than from poorer ones.
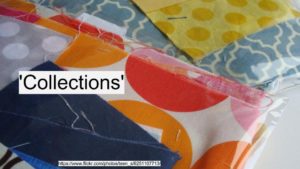 You probably already all know this, but it's worth remembering: our collections aren't even (yet) a patchwork of materials. The collections we hold, and the subset we can digitise and make available for re-use are only a tiny proportion of what once existed. Each piece was once part of something bigger, and what we have now has been shaped by cumulative practical and intellectual decisions made over decades or centuries. Digitisation projects range from tiny specialist databases to huge commercial genealogy deals, while some areas of the collections don't yet have digital catalogue records. Some items can't be digitised because they're too big, small or fragile for scanning or photography; others can't be shared because of copyright, data protection or cultural sensitivities. We need to be careful in how we label datasets so that the absences are evident.
(Here, 'data' may include various types of metadata, automatically generated OCR or handwritten text recognition transcripts, digital images, audio or video files, crowdsourced enhancements or any combination or these and more)
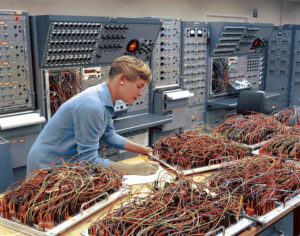
Image credit: https://www.flickr.com/photos/teen_s/6251107713/
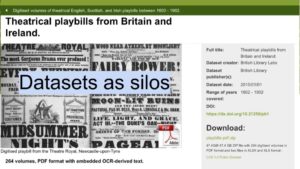 In addition to the incompleteness or fuzziness of catalogue data, when collections appear as data, it's often as great big lumps of things. It's hard for normal scholars to process (or just unzip) 4gb of data.
Currently, datasets are often created outside normal processes, and over time they become 'stale' as they're not updated when source collections records change. And when they manage to unzip them, the records rely on internal references – name authorities for people, places, etc – that can only be seen as strings rather than things until extra work is undertaken.
The BL's metadata team have experimented with 'researcher format' CSV exports around specific themes (eg an exhibition), and CSV is undoubtedly the most accessible format – but what we really need is the ability for people to create their own queries across catalogues, and create their own datasets from the results. (And by queries I don't mean SPARQL but rather faceted browsing or structured search forms).
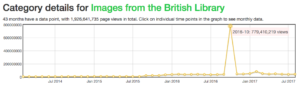
Image credit: screenshot from http://data.bl.uk/
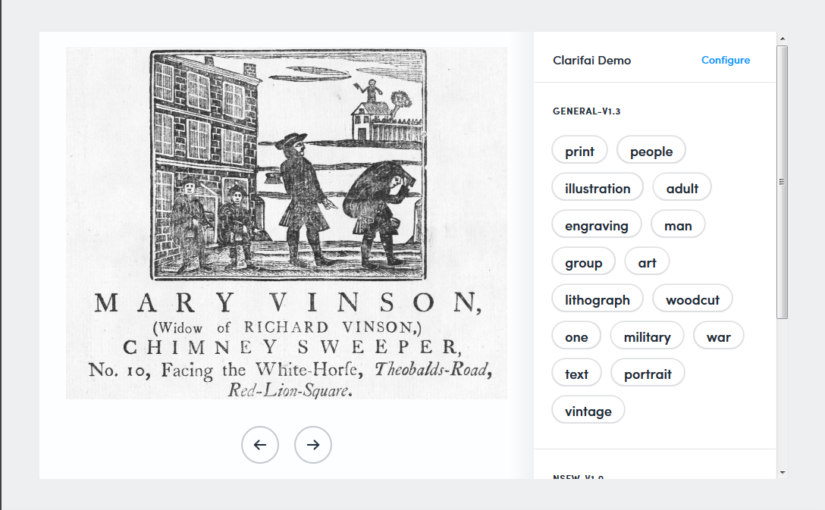
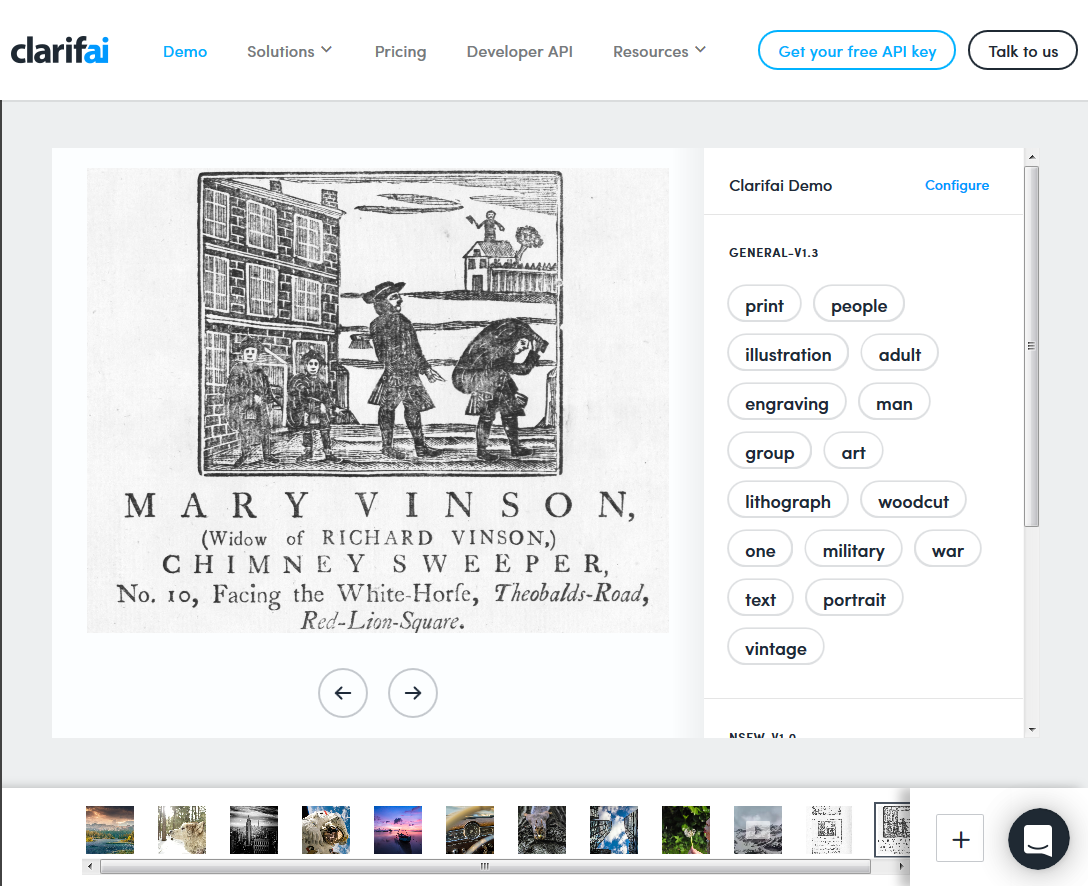
 Collections are huge (and resources relatively small) so we need to supplement manual cataloguing with other methods. Sometimes the work of crafting links from catalogues to external authorities and identifiers will be a machine job, with pieces sewn together at industrial speed via entity recognition tools that can pull categories out or text and images. Sometimes it's operated by a technologist who runs records through OpenRefine to find links to name authorities or Wikidata records. Sometimes it's a labour of scholarly love, with links painstakingly researched, hand-tacked together to make sure they fit before they're finally recorded in a bespoke database.
This linking work often happens outside the institution, so how can we ingest and re-use it appropriately? And if we're to take advantage of computational methods and external enhancements, then we need ways to signal which categories were applied by catalogues, which by software, by external groups, etc.
The workflow and interface adjustments required would be significant, but even more challenging would be the internal conversations and changes required before a consensus on the best way to combine the work of cataloguers and computers could emerge.
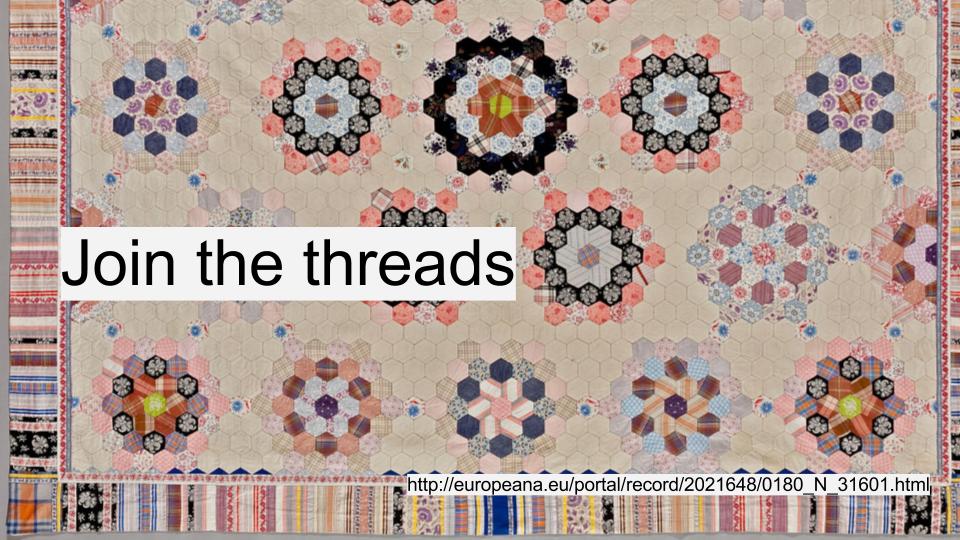 The trick is to move from a collection of pieces to pieces of a collection. Every collection item was created in and about places, and produced by and about people. They have creative, cultural, scientific and intellectual properties. There's a web of connections from each item that should be represented when they appear in datasets. These connections help make datasets more usable, turning strings of text into references to things and concepts to aid discoverability and the application of computational methods by scholars. This enables structured search across datasets – potentially linking an oral history interview with a scientist in the BL sound archive, their scientific publications in journals, annotated transcriptions of their field notebooks from a crowdsourcing project, and published biography in the legal deposit library.
A lot of this work has been done as authority files like AAT, ULAN etc are applied in cataloguing, so our attention should turn to turning local references into URIs and making the most of that investment.
Applying identifiers is hard – it takes expert care to disambiguate personal names, places, concepts, even with all the hinting that context-aware systems might be able to provide as machine learning etc techniques get better. Catalogues can't easily record possible attributions, and there's understandable reluctance to publish an imperfect record, so progress on the backlog is slow. If we're not to be held back by the need for records to be perfectly complete before they're published, then we need to design systems capable of capturing the ambiguity, fuzziness and inherent messiness of historical collections and allowing qualified descriptors for possible links to people, places etc. Then we need to explain the difference to users, so that they don't overly rely on our descriptions, making assumptions about the presence or absence of information when it's not appropriate.
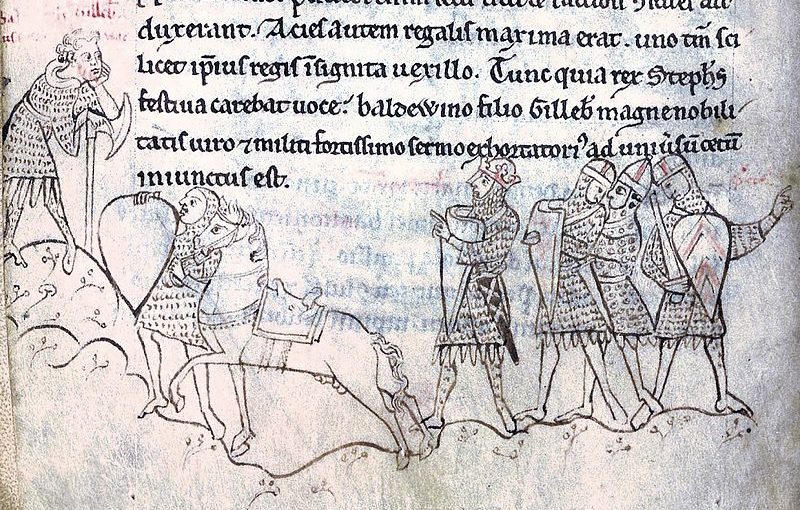
Image credit: http://europeana.eu/portal/record/2021648/0180_N_31601.html
 A lot of what we need relies on more responsive infrastructure for workflows and cataloguing systems. For example, the BL's systems are designed around the 'deliverable unit' – the printed or bound volume, the archive box – because for centuries the reading room was where you accessed items. We now need infrastructure that makes items addressable at the manuscript, page and image level in order to make the most of the annotations and links created to shared identifiers.
(I'd love to see absorbent workflows, soaking up any related data or digital surrogates that pass through an organisation, no matter which system they reside in or originate from. We aren't yet making the most of OCRd text, let alone enhanced data from other processes, to aid discoverability or produce datasets from collections.)
Image credit: https://www.flickr.com/photos/snorski/34543357
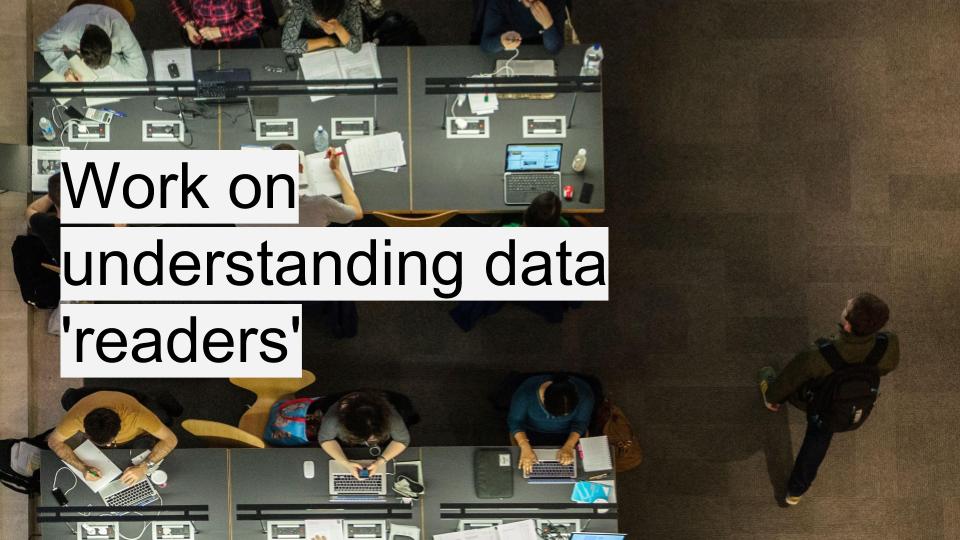
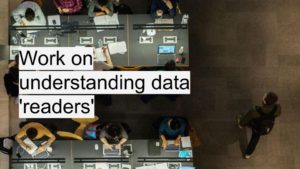 My final thought – we can start small and iterate, which is just as well, because we need to work on understanding what users of collections data need and how they want to use them. We're making a start and there's a lot of thoughtful work behind the scenes, but maybe a bit more investment is needed from research libraries to become as comfortable with data users as they are with the readers who pass through their physical doors.


