Hands up if someone you know gave or received a mobile phone or tablet over the holidays? And how long was it before they snuck away to quietly checked their favourite social networks or the sales with their new device? Some people will end up on a cultural heritage site. Sometimes it's because they now have a device to hand to look up random questions that arise while they're watching Downton Abbey or they're looking for entertainment for future commutes; others might try booking tickets for a show from their kitchen or keeping the kids quiet with a few games.
What will they see when they hit your site? Will the games and interactives have disappeared for Apple devices without Flash, will they struggle to fill in forms on your non-responsive site – or will they be welcomed to a site optimised for their device?
Of course the short answer is, yes, Christmas (and the past few years) have changed how audiences see your website. This post is a guide to using Google Analytics to put numbers against that statement and working out where you need to improve the experience for visitors on mobiles and tablets, but if you don't have access to Google Analytics then just assume lots of visitors are on mobile and make sure your site will work for them. There's no substitute for trying to perform typical visitor tasks with real devices, but emulators for iPads, tablets, TVs, mobiles, responsive design, etc can help you get started. And if you're promoting content on social media and don't have a mobile/tablet ready site, then you're effectively inviting people over then slamming the door in their face, so just fix your site already.
If you do have access to Google Analytics, here are some tips for assessing the impact of all that gift-giving and working out the velocity of change in mobile and tablet visits on your site to understand what you're facing in the coming year (and getting to grips with Analytics while you're at it). Understanding how quickly your audience is changing and what people are doing on your site will a) help you decide which key tasks and sections to test with actual devices, PageSpeed Insights etc, and b) prioritise technical changes in the immediate future.
This assumes you know the basics of using Google Analytics – if you need a refresher, try the guides to Google Analytics Healthcheck and Google Analytics Segments I wrote for the Audience Agency's Audience Finder (though some of the screens have changed since then).
View mobile and tablet visits with built-in Google Analytics Segments and custom date ranges
The simplest way to assess how much of your website traffic is from mobile or tablet devices is to navigate to the Audiences/Mobile/Overview report, then click on the dates on the top right-hand corner and set the left-hand date to a year or two in the past and the right-hand date to now. You'll probably see a gradual increase in total visits over time, and some information underneath that about the total numbers of visits from 'desktop', 'mobile' and 'tablet' devices.
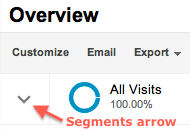 For a more useful breakdown of the number of desktop, mobile and tablet devices over time on other reports – whether Content reports like popular, Landing and Exit pages, location ('geo') or how people got to your site (aka 'acquisition') – you need to apply some Segments. To open the Segments option box, click the small down arrow next to 'All visits', as in the screenshot.
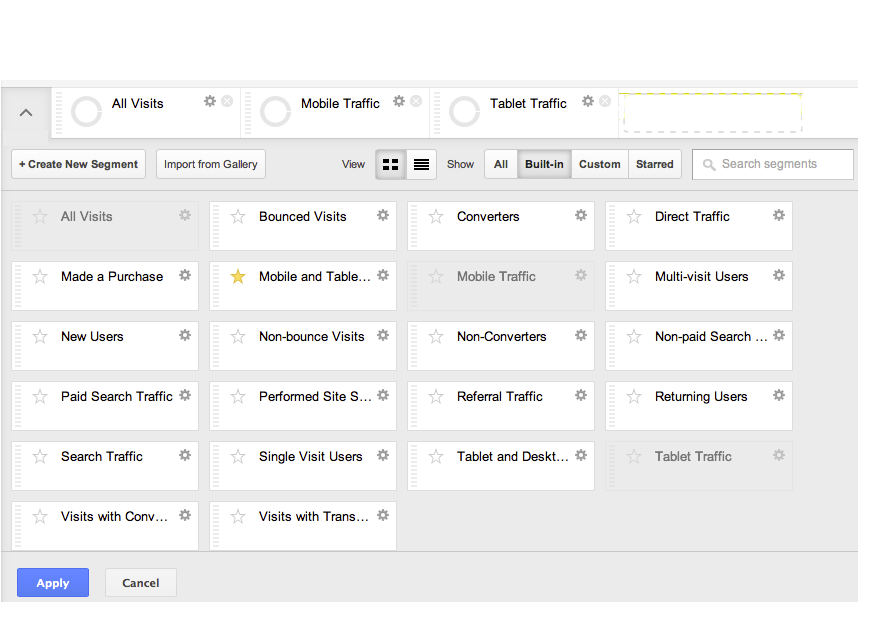
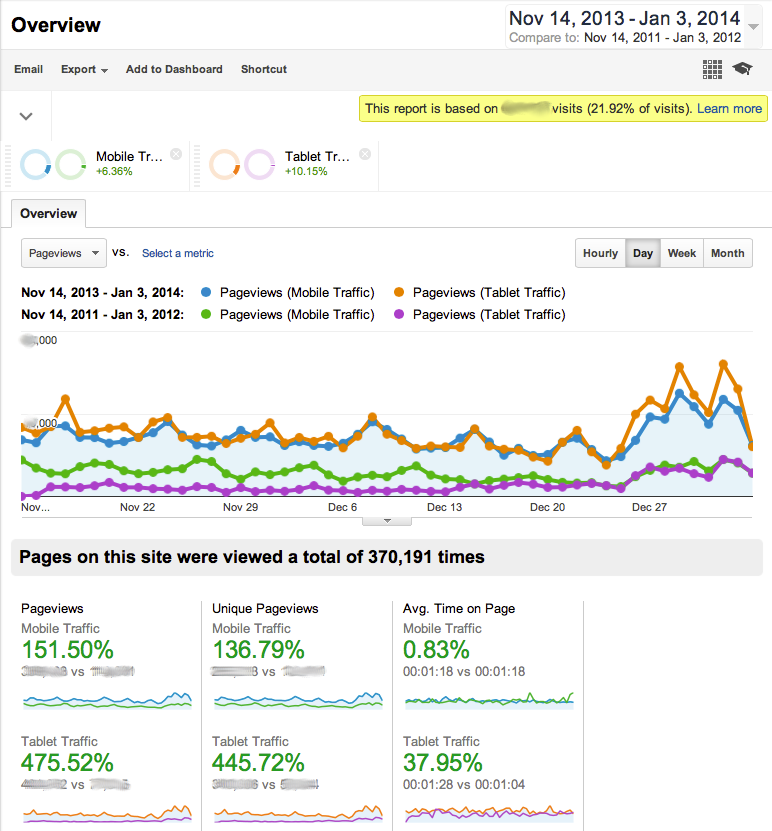
This will open a screen (below) showing a range of built-in segments. For now, click 'Mobile Traffic' and 'Tablet Traffic' to add them to the selected Segments list. Click 'Apply' and view the breakdown of visits by device over time. Hover over the lines for more detail. You can change reports and the segments will stay selected until you unselect them. (For later: explore other built-in segments, and learn how to make your own to answer questions that matter to your organisation.)
Tips: viewing stats by week rather than by day can help any patterns stand out more clearly. If you get a lot of traffic overall, you'll be able to see the difference in mobile/tablet visits more clearly if you take out the 'All Visits' segment.
Using the built-in date range fields to compare change over time
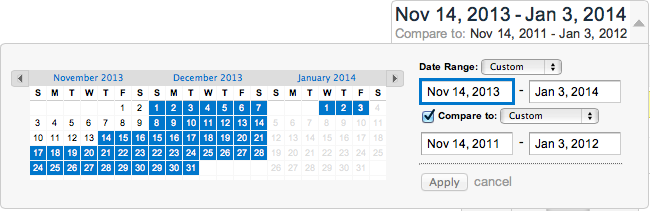
Tips: if there are odd spikes or gaps in your stats, you might want to pick your dates around them (or add an explanatory annotation). If you have the data, try comparing the same time of year over e.g. 2011/12 to see the difference a couple of years have made. If you want to dive into the numbers to understand the devices more, the 'Browser & OS' report is useful, or explore the 'Primary Dimensions' on the 'Devices' report.
Learn Analytics by answering questions specific to your site
Working with participants in the Let's Get Real project reminded me that having a specific question to answer is a good way to find your way through the mass of options in Google Analytics, so for bonus points, pick one or two of these to answer:
- What traffic was there to your website on Christmas Day?
- How did they get there and what were they looking at?
- What kinds of transactions or interactions have people attempted on your site in the last six weeks?
- Where do you lose people? Does it vary by device or is another factor more important?
- On which pages or site sections do tablet visitors spend the most time? What about mobile visitors?
- Was the increase in device usage larger this holiday or in previous years?
- And following a comment from the Guardian's Tom Grinsted, how do visit demographics differ on weekends/weekdays? What about morning/daytime/evening visits?