Back in November 2015, Tara Andrews invited me to give a guest lecture on 'digital history' for the Introduction to Digital Humanities course at the University of Bern, where she was then a professor. This is a slightly shortened version of my talk notes, finally posted in 2024 as I go back to thinking about what 'digital history' actually is.
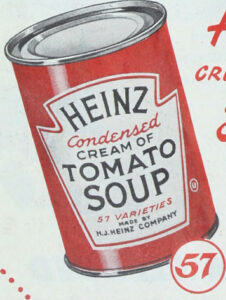 I called my talk '57 varieties of digital history' as a play on the number of activities and outputs called 'digital history'. While digital history and digital humanities are often linked and have many methods in common, digital history also draws on the use of computers for quantitative work, and digitisation projects undertaken in museums, libraries, archives and academia. Digital tools have enhanced many of the tasks in the research process (which itself has many stages – I find the University of Minnesota Libraries' model with stages of 'discovering', 'gathering', 'creating' and 'sharing' useful), but at the moment the underlying processes often remain the same.
So, what is digital history?
…using computers for writing, publishing
A historian on twitter once told me about a colleague who said they're doing digital history because they're using PowerPoint. On reflection, I think they have a point. These simple tools might be linked to fairly traditional scholarship – writing journal articles or creating presentations – but text created in them is infinitely quotable, shareable, and searchable, unlike the more inert paper equivalents. Many scholars use Word documents to keep bits of text they've transcribed from historical source materials, or to keep track of information from other articles or books. These become part of their personal research collections, which can build up over years into substantial resources in their own right. Even 'helper' applications like reference managers such as Zotero or EndNote can free up significant amounts of time that can then be devoted to research.
…the study of computers
When some people hear 'digital history', they imagine that it's the study of computers, rather than the use of digital methods by historians. While this isn't a serious definition of digital history, it's a reminder that viewing digital tools through a history of science and technology lens can be fruitful.
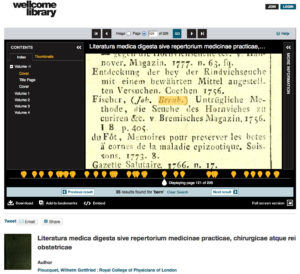
…using digitised material
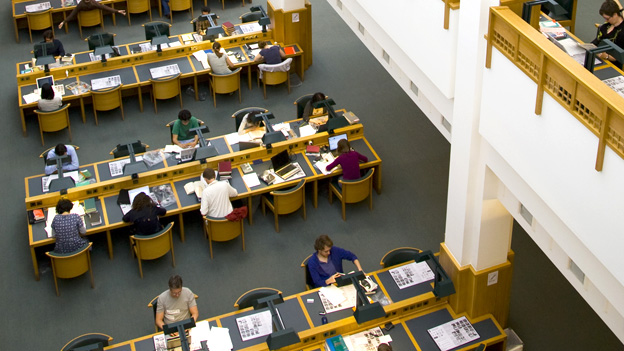
Digitisation takes many forms, including creating or transcribing catalogue records about heritage collections, writing full descriptions of items, and making digital images of books, manuscripts, artworks etc. Metadata – information about the item, such as when and where it was made – is the minimum required to make collections discoverable. Increasingly, new forms of photography may be applied to particular types of objects to capture more information than the naked eye can see. Text may be transcribed, place names mapped, marginalia annotated and more.
The availability of free (or comparatively inexpensive) historical records through heritage institutions and related commercial or grassroots projects means we can access historical material without having to work around physical locations and opening hours, negotiate entry to archives (some of which require users to be 'bona fide scholars'), or navigate unknown etiquettes. Text transcription allows readers who lack the skills to read manuscript or hand-written documents to make use of these resources, as well as making the text searchable.
For some historians, this is about as digital as they want to get. They're very happy with being able to access more material more conveniently; their research methods and questions are still pretty unchanged.
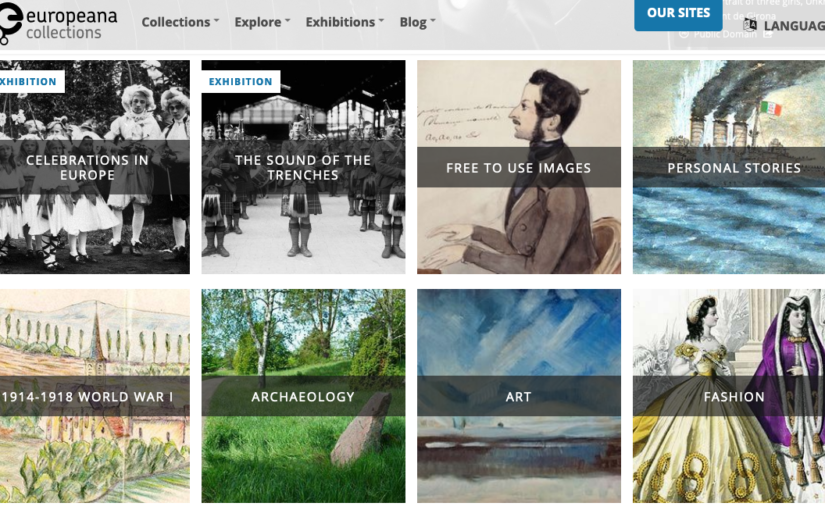
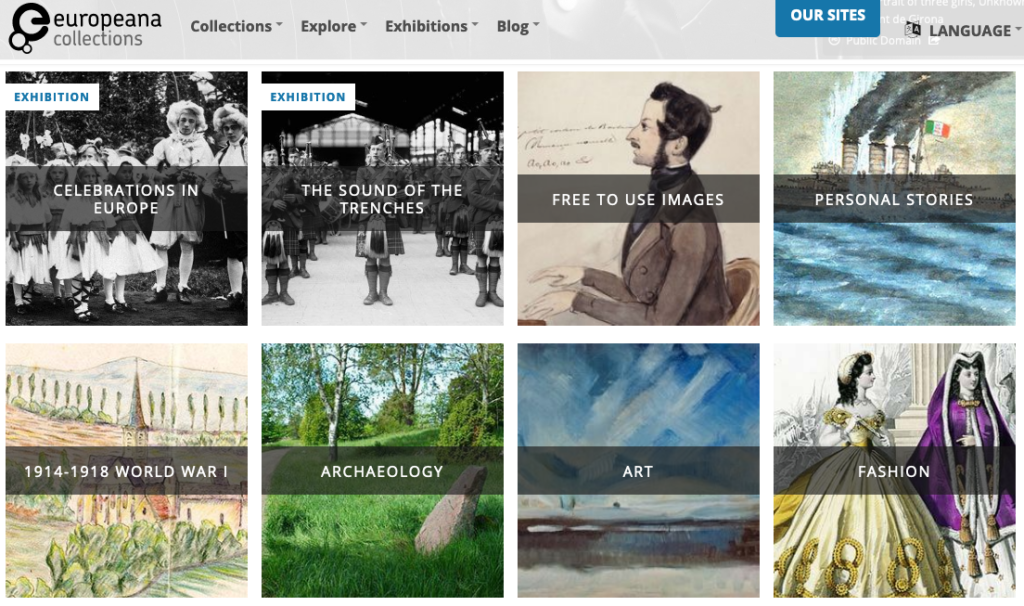
…creating digital repositories
Most digitised items live in some broader system that aggregates and presents material from a particular institution, or related to a particular topic. While some digital repositories are based on sub-sets of official institutional collections, most aren't traditional 'archives'. One archivist describes digital repositories as a 'purposeful collection of surrogates'.
Repositories aren't always created by big, funded projects. Personal research collections assembled over time are one form of ad hoc repository – they may contain material from many different archives collected by one researcher over a number of years.
Themed collections may be the result of large, scholarly projects with formal partners who've agreed to contribute material about a particular time, place, group in society or topic. They might also be the result of work by a local history society with volunteers who digitise material and share it online.
'Commons' projects (like Flickr or Wikimedia Commons) tend to be less focused – they might contain collections from specific institutions, but these specific collections are aggregated into the whole repository, where their identity (and the provenance of individual items) may be subsumed. While 'commons' platforms technically enable sharing, the cultural practices around sharing are yet to change, particularly for academic historians and many cultural institutions.
Repositories can provide different functionality. In some 'scholarly workbenches' you can collect and annotate material; in others you can bookmark records or download images. They allow support different levels of access. Some allow you to download and re-use material without restriction, some only allow non-commercial use, and some are behind paywalls.
…creating datasets
The Old Bailey Online project has digitised the proceedings of the Old Bailey, making court cases from 1674 to 1913 available online. They haven't just transcribed text from digital images, they've added structure to the text. For example, the defendant's name, the crime he was accused of and the victim's name have all been tagged. The addition of this structure means that the material can be studied as text, or analysed statistically.
Adding structure to data can enable innovative research activities. If the markup is well-designed, it can support the exploration of questions that were not envisaged when the data was created. Adding structure to other datasets may become less resource-intensive as new computational techniques become available.
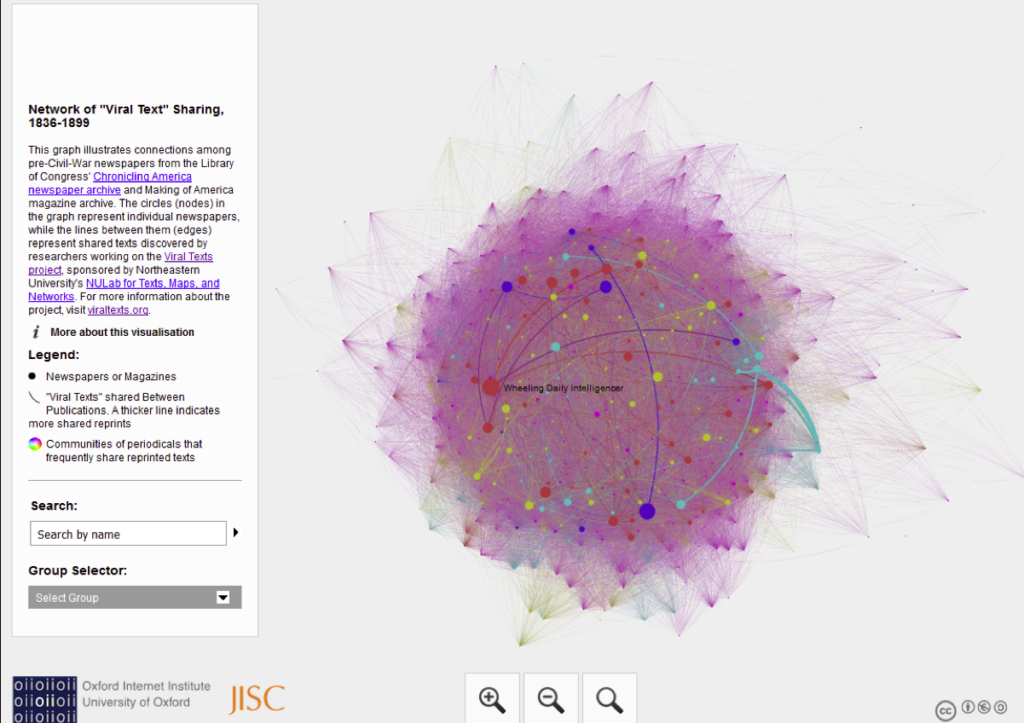
…creating visualisations and innovative interfaces
Some people or projects create specialist interfaces to help people explore their datasets. They might be maps or timelines that help people understand the scope of a collection in time and place, while others are more interpretive, presenting a scholarly argument through their arrangement of interface elements, the material they have assembled, the labels they use and the search or browse queries they support. Ideally, these interfaces should provide access to the original records underlying the visualisation so that scholars can investigate potential new research questions that arise from their use of the interface.
…creating linked data (going from strings to things)
As well as marking up records with information like 'this bit is a defendant's name', we can also link a particular person's name to other records about them online. One way to do this is to link their name to published lists of names online. These stable identifiers mean that we could link any mention of a particular person in a text to this online identifier, so that 'Captain Cook' or 'James Cook' are understood to be different strings about the same person.
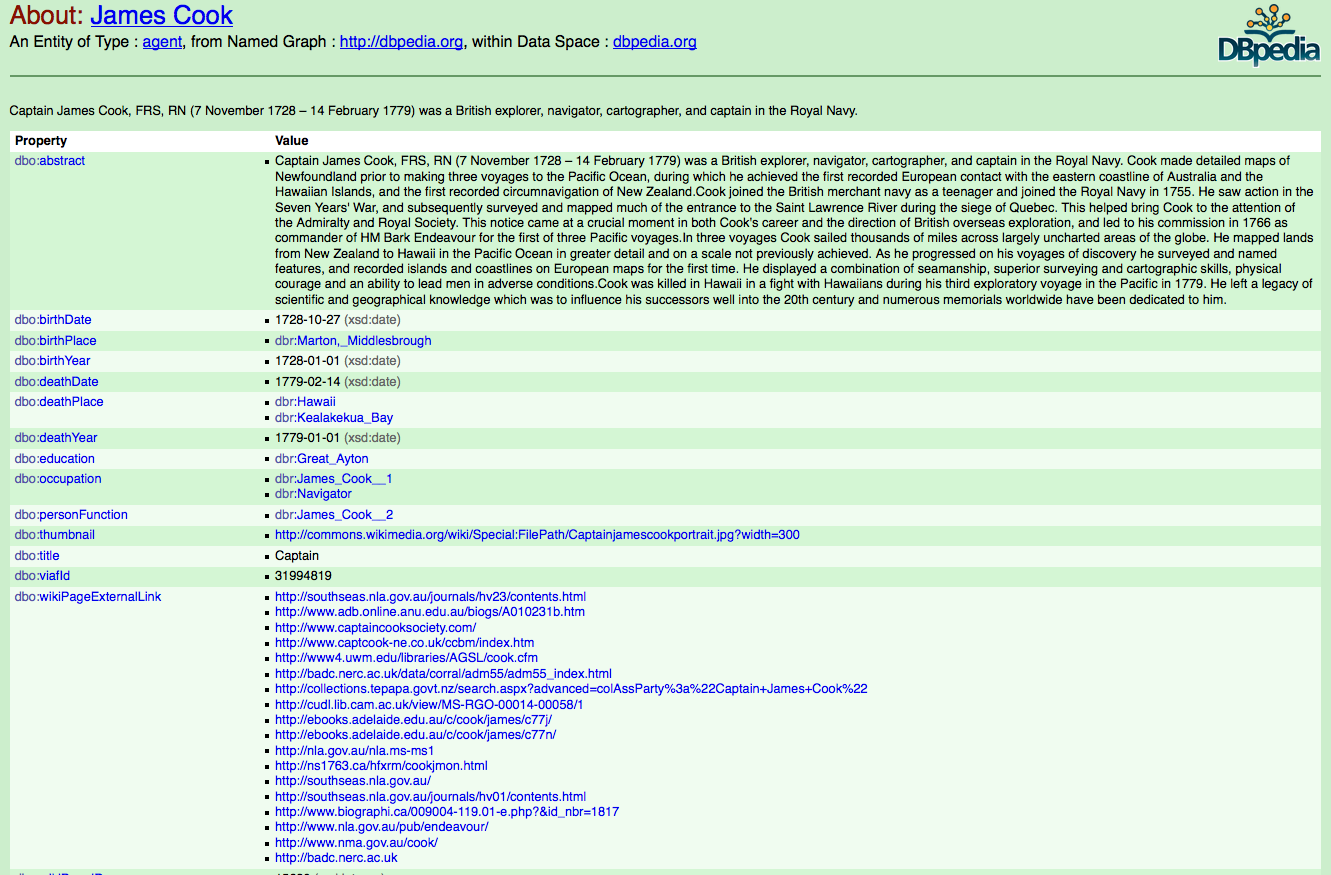
This also helps create a layer of semantic meaning about these strings of text. Software can learn that strings that represent people can have relationships with other things – in this case, historical voyages, other people, natural history and ethnographic collections, and historical events.
…applying computational methods, tools to digitised sources
So far some of what we've seen has been heavily reliant on manual processing – someone has had to sit at a desk and decide which bit of text is about the defendant and which about the victim in an Old Bailey case.
So people are developing software algorithms to find concepts – people, places, events, etc – within text. This is partly a response to amount of digitised text now available; partly a response to recognition of power of structured data. Techniques like 'named entity recognition' help create structure from unstructured data. This allows data to be queried, contextualised and presented in more powerful ways.
The named entity recognition software here [screenshot lost?] knows some things about the world – the names of places, people, dates, some organisations. It also gets lots of things wrong – it doesn't understand 'category five storm' as a concept, it mixes up people and organisations – but as a first pass, it has potential. Software can be trained to understand the kinds of concepts and things that occur in particular datasets. This also presents a problem for historians, who may have to use software trained for modern, commercial data.
This is part of a wider exploration of 'distant reading', methods for understanding what's in a corpus by processing the text en masse rather than by reading each individual novel or document. For example, it might be used to find linguistic differences between genres of literature, or between authors from different countries.
In this example [screenshot of topic modelling lost?], statistically unlikely combinations of words have been grouped together into 'topics'. This provides a form of summary of the contents of text files.
Image tagging – 'machine learning' techniques mean that software can learn how to do things rather than having to be precisely programmed in advance. This will have more impact on the future of digital history as these techniques become mainstream.
Audio tagging – software suggests tags, humans verify them. Quicker than doing them from scratch, but possible for software to miss significant moments that a person would spot. (e.g. famous voices, cultural references, etc).
Handwritten text recognition will transform manuscript sources such as much as optical character recognition has transformed typed sources!
Studying born digital material (web archives, social media corpus etc)
Important historical moments, such as the 'Arab spring', happened on social media platforms like twitter, youtube and facebook. The British Library and the Internet Archive have various 'snapshots' of websites, but they can only hope to capture a part of online material. We've already lost significant chunks of web history – every time a social media platform is shut without being archived, future historians have lost valuable data. (Not to mention people's personal data losses).
This also raises questions about how we should study 'digital material culture'. Websites like Facebook really only make sense when they're used in a social context. The interaction design of 'likes' and comments, the way a newsfeed is constructed in seconds based on a tiny part of everything done in your network – these are hard to study as a series of static screenshots or data dumps.
…sharing history online
Sharing research outputs is great. It some point it starts to intersect with public history. But questions remain about 'broadcast' vs 'discursive' modes of public history – could we do more than model old formats online? Websites and social media can be just as one-way broadcast as television unless they're designed for two-way participation.
What's missing?
Are there other research objects or questions that should be included under the heading 'digital history'? [A question to allow for discussion time]
Towards the future of looking at the past
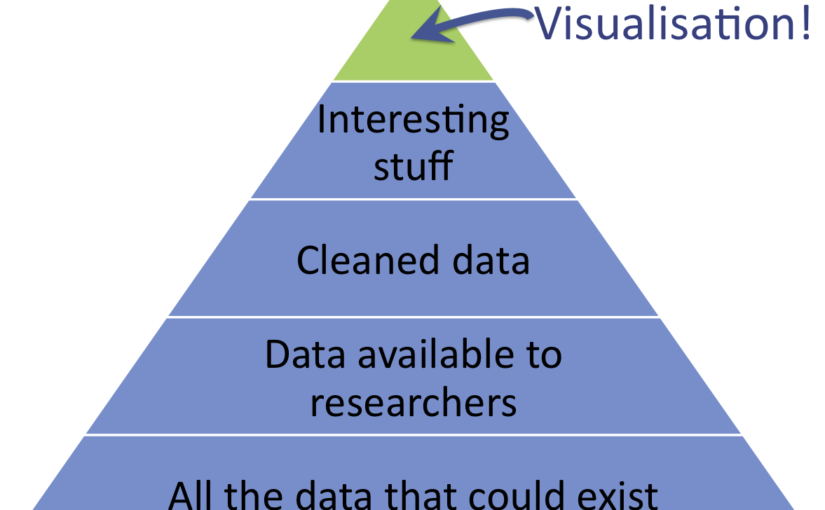
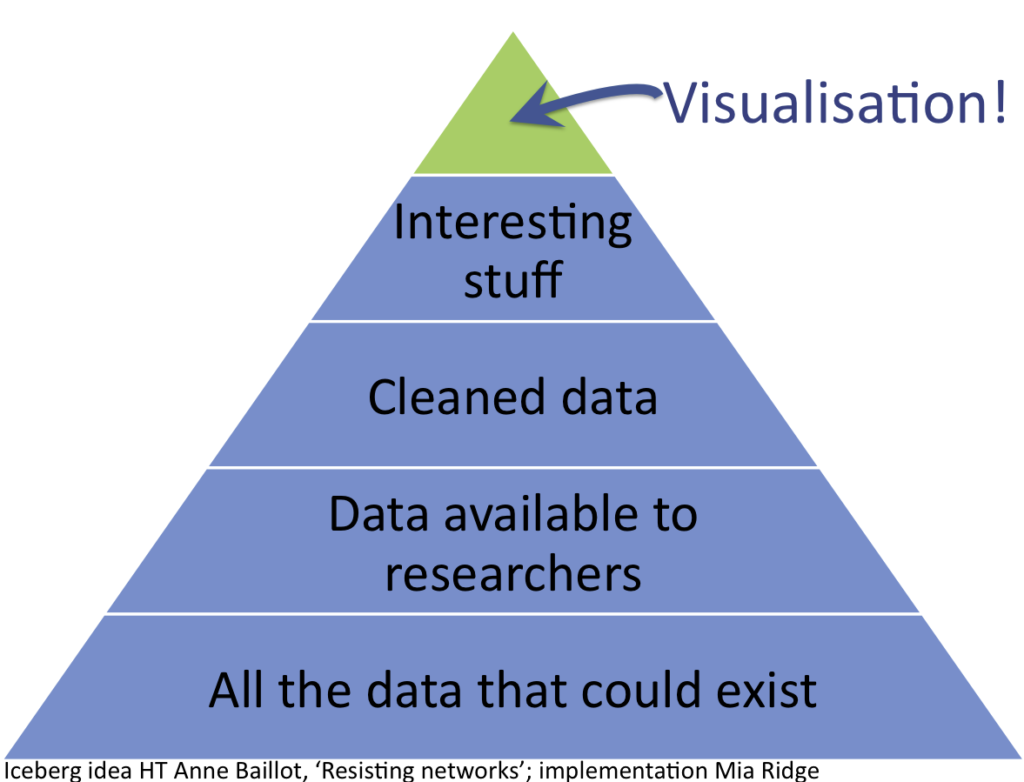
To sum up what we've seen so far – we've seen the transformation of unorganised, unprocessed data into 'information' through research activities like 'classification, rearranging/sorting, aggregating, performing calculations, and selection'.
Historical material is being transformed from a 'page' to a 'dataset'. As some of this process is automated, it raises new questions – how do we balance the convenience of automatic processing with the responsibility to review and verify the results? How do we convey the processes that went into creating a dataset so that another researcher can understand its gaps, the mixture of algorithmic and expert processes applied to it? My work at the British Library has made the importance of versioning a dataset or corpus clear – if a historian bases an argument on one version of OCR text, and the next version is better, they should be able to link to the version they based their work on.
We've thought about how digital text and media allows for new forms of analysis, using methods such as data visualisation, topic modelling or data mining. These methods can yield new insights and provoke new research questions, but most are not yet accessible to the ordinary historian. While automated processes help, preparing data for digital history is still incredibly detailed, time-consuming work.
What are the pros and cons of the forms of digital history discussed?
Cons
The ability to locate records on consumer-facing services like Google Maps is valuable, but commercial, general use mapping tools are not always suitable for historical data, which is often fuzzy, messy, and of highly variable coverage and precision. For example, placing text or points on maps can suggest a degree of certainty not supported by the data. Locating historical addresses can be inherently uncertain in instances where street numbers were not yet in use, but most systems expect a location to be placed as a precise dot (point of interest) on a map; drawing a line to mark a location would at least allow the length of a street to be marked as a possible address.
There is an unmet need for everyday geospatial tools suitable for historians. For example, those with datasets containing historical locations would appreciate the ability to map addresses from specific periods on historical maps that are georeferenced, georectified and displayable on a modern, copyright-free map or the historical map. Similarly, biographical software, particularly when used for family history, collaborative prosopographical or community history projects would benefit from the ability to record the degree of certainty for potential-but-not-yet-proven relationships or identifications, and to link uncertain information to specific individuals.
The complexity of some software packages (or the combination of packages assembled to meet various needs) is a barrier for those short on time, unable to access dedicated support or training, or who do not feel capable of learning the specialist jargon and skills required to assess and procure software to meet their needs. The need for equipment and software licences can be a financial barrier; unclear licensing requirements and costs for purchasing high-resolution historical maps are another. Copyright and licensing are also complex issues.
Sensible historians worry about the sustainability of digital sites – their personal research collection might be around for 30 years or more; and they want to cite material that will be findable later.
There are issues with representing historical data, particularly in modern tools that cannot represent uncertainty, contingency. Here [screenshot lost?]the curator's necessarily fuzzy label of 'early 17th century' has been assigned to a falsely precise date. Many digital tools are not (yet) suitable for historical data. Their abilities have over-stated or their limits not clearly communicated/understood.
Very few peer-reviewed journals are able to host formats other than articles, inhibiting historians' ability to explore emerging digital formats for presenting research.
Faculty historians might dream of creating digital projects tailored for the specific requirements of their historical dataset, research question and audience, but their peers may not be confident in their ability to evaluate the results and assign credit appropriately.
Pros
Material can be recontextualised, transcluded, linked, contextualised. The distance between a reference and the original item reduced to just a link (unless a paywall etc gets in the way). Material can be organised in multiple ways independent of their physical location. Digital tools can represent multiple commentaries or assertions on a single image or document through linked annotations.
Computational techniques for processing data could reduce the gap between well-funded projects and others, thereby reducing the likelihood of digital history projects reinscribing the canon.
Digitised resources have made it easier to write histories of ordinary lives. You can search through multiple databases to quickly collate biographical info (births, deaths, marriages etc) and other instances when their existence might be documented. This isn't just a change in speed, but also in the accessibility of resources without travel, expense.
Search – any word in a digitised text can be a search result – we're not limited to keywords in a catalogue record. We can also discover some historical material via general search engines. Phonetic and fuzzy searches have also improved the ability to discover sources.
Historians like Professor Katrina Navickas have shown new models for the division of labour between people and software; previously most historical data collection and processing was painstakingly done by historians. She and others have shown how digital techniques can be applied to digitised sources in the pursuit of a historical research question.
Conclusion and questions: digital history, digital historiography?
The future is here, it's just not evenly distributed (this is the downer bit)
Academic historians might find it difficult to explore new forms of digital creation if they are hindered by the difficulties of collaborating on interdisciplinary digital projects and their need for credit and attribution when publishing data or research. More advanced forms of digital history also require access to technical expertise. While historians should know the basics of computational thinking, most may not be able to train as a programmer and as a historian – how much should we expect people to know about making software?
I've hinted at the impact of convenience in accessing digitised historical materials, and in those various stages of 'discovering', 'gathering', 'creating' and 'sharing'… We must also consider how experiences of digital technologies have influenced our understanding of what is possible in historical research, and the factors that limit the impact of digital technologies. The ease with which historians transform data from text notes to spreadsheets to maps to publications and presentations is almost taken for granted, but it shows the impact of digitality on enhancing everyday research practices.
So digital history has potential, is being demonstrated, but there's more to do…