The good, the bad, and the unstructured… Open data in cultural heritage

I was in London this week for the Linked Pasts event, where I presented on trends and practices for open data in cultural heritage. Linked Pasts was a colloquium on linked open data in cultural heritage organised by the Pelagios project (Leif Isaksen, Elton Barker and Rainer Simon with Pau de Soto). I really enjoyed the other papers, which included thoughtful, grounded approaches to structured data for historical periods, places and people, recognition of the importance of designing projects around audience needs (including user research), the relationship between digital tools and scholarly inquiry, visualisations as research tools, and the importance of good infrastructure for digital history.

My talk notes are below the embedded slides.

Warning: generalisations ahead.

My discussion points are based on years of conversations with other cultural heritage technologists in museums, libraries, and archives, but inevitably I'll have blind spots. For example, I'm focusing on the English-speaking world, which means I'm not discussing the great work that Dutch and Japanese organisations are doing. I've undoubtedly left out brilliant specific examples in the interests of focusing on broader trends. The point is to start conversations, to bring issues out into the open so we can collectively decide how to move forward.

The good

The good news is that more and more open cultural data is being published. Organisations have figured out that a) nothing bad is likely to happen and that b) they might get some kudos for releasing open data.

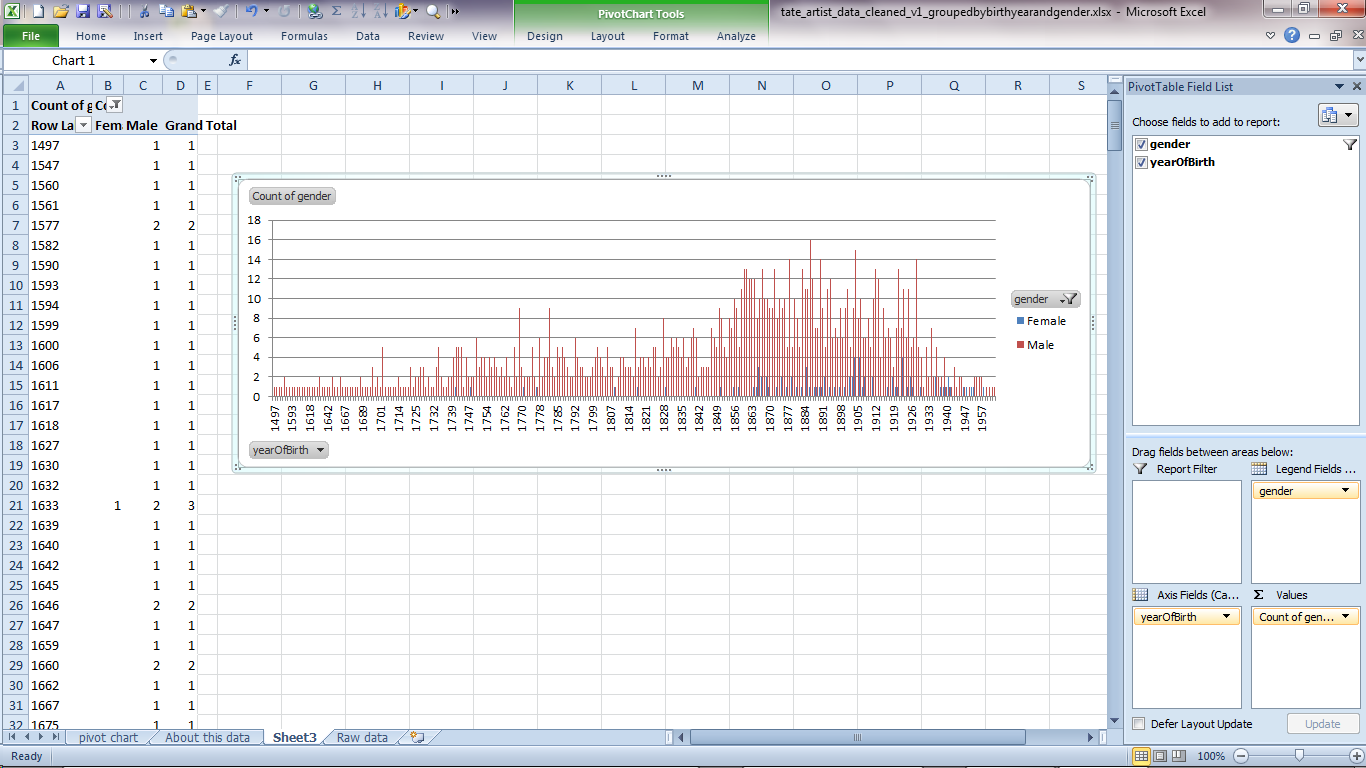
Generally, organisations are publishing the data that they have to hand – this means it's mostly collections data. This data is often as messy, incomplete and fuzzy as you'd expect from records created by many different people using many different systems over a hundred or more years.

…the bad…

Copyright restrictions mean that images mightn't be included. Furthermore, because it's often collections data, it's not necessarily rich in interpretative information. It's metadata rather than data. It doesn't capture the scholarly debates, the uncertain attributions, the biases in collecting… It certainly doesn't capture the experience of viewing the original object.

Licensing issues are still a concern. Until cultural organisations are rewarded by their funders for releasing open data, and funders free organisations from expectations for monetising data, there will be damaging uncertainty about the opportunity cost of open data.

Non-commercial licenses are also an issue – organisations and scholars might feel exploited if others who have not contributed to the process of creating it can commercially publish their work. Finally, attribution is an important currency for organisations and scholars but most open licences aren't designed with that in mind.

…and the unstructured

The data that's released is often pretty unstructured. CSV files are very easy to use, so they help more people get access to information (assuming they can figure out GitHub), but a giant dump like this doesn't provide stable URIs for each object. Records in data dumps rarely link to external identifiers like the Getty's Thesaurus of Geographic Names, Art & Architecture Thesaurus (AAT) or Union List of Artist Names, or vernacular sources for place and people names such as Geonames or DBPedia. And that's fair enough, because people using a CSV file probably don't want all the hassle of dereferencing each URI to grab the place name so they can visualise data on a map (or whatever they're doing with the data). But it also means that it's hard for someone to reliably look for matching artists in their database, and link these records with data from other organisations.

So it's open, but it's often not very linked. If we're after a 'digital ecosystem of online open materials', this open data is only a baby step. But it's often where cultural organisations finish their work.

Classics > Cultural Heritage?

But many others, particularly in the classical and ancient world, have managed to overcome these issues to publish and use linked open data. So why do museums, libraries and archives seem to struggle? I'll suggest some possible reasons as conversation starters…

Not enough time

Organisations are often busy enough keeping their internal systems up and running, dealing with the needs of visitors in their physical venues, working on ecommerce and picture library systems…

Not enough skills

Cultural heritage technologists are often generalists, and apart from being too time-stretched to learn new technologies for the fun of it, they might not have the computational or information science skills necessary to implement the full linked data stack.

Some cultural heritage technologists argue that they don't know of any developers who can negotiate the complexities of SPARQL endpoints, so why publish it? The complexity is multiplied when complex data models are used with complex (or at least, unfamiliar) technologies. For some, SPARQL puts the 'end' in 'endpoint', and 'RDF triples' can seem like an abstraction too far. In these circumstances, the instruction to provide linked open data as RDF is a barrier they won't cross.

But sometimes it feels as if some heritage technologists are unnecessarily allergic to complexity. Avoiding unnecessary complexity is useful, but progress can stall if they demand that everything remains simple enough for them to feel comfortable. Some technologists might benefit from working with people more used to thinking about structured data, such as cataloguers, registrars etc. Unfortunately, linked open data falls in the gap between the technical and the informatics silos that often exist in cultural organisations.

And organisations are also not yet using triples or structured data provided by other organisations [with the exception of identifiers for e.g. people, places and specific vocabularies]. They're publishing data in broadcast mode; it's not yet a dialogue with other collections.

Not enough data

In a way, this is the collections documentation version of the technical barriers. If the data doesn't already exist, it's hard to publish. If it needs work to pull it out of different departments, or different individuals, who's going to resource that work? Similarly, collections staff are unlikely to have time to map their data to CIDOC-CRM unless there's a compelling reason to do so. (And some of the examples given might use cultural heritage collections but are a better fit with the work of researchers outside the institution than the institution's own work).

It may be easier for some types of collections than others – art collections tend to be smaller and better described; natural history collections can link into international projects for structured data, and libraries can share cataloguing data. Classicists have also been able to get a critical mass of data together. Your local records office or small museum may have more heterogeneous collections, and there are fewer widely used ontologies or vocabularies for historical collections. The nature of historical collections means that 'small ontologies, loosely joined', may be more effective, but creating these, or mapping collections to them, is still a large piece of work. While there are tools for mapping to data structures like Europeana's data model, it seems the reasons for doing so haven't been convincing enough, so far. Which brings me to…

Not enough benefits

This is an important point, and an area the community hasn't paid enough attention to in the past. Too many conversations have jumped straight to discussion about the specific standards to use, and not enough have been about the benefits for heritage audiences, scholars and organisations.

Many technologists – who are the ones making decisions about digital standards, alongside the collections people working on digitisation – are too far removed from the consumers of linked open data to see the benefits of it unless we show them real world needs.

There's a cost in producing data for others, so it needs to be linked to the mission and goals of an organisation. Organisations are not generally able to prioritise the potential, future audiences who might benefit from tools someone else creates with linked open data when they have so many immediate problems to solve first.

While some cultural and historical organisations have done good work with linked open data, the purpose can sometimes seem rather academic. Linked data is not always explained so that the average, over-worked collections or digital team will that convinced by the benefits outweigh the financial and intellectual investment.

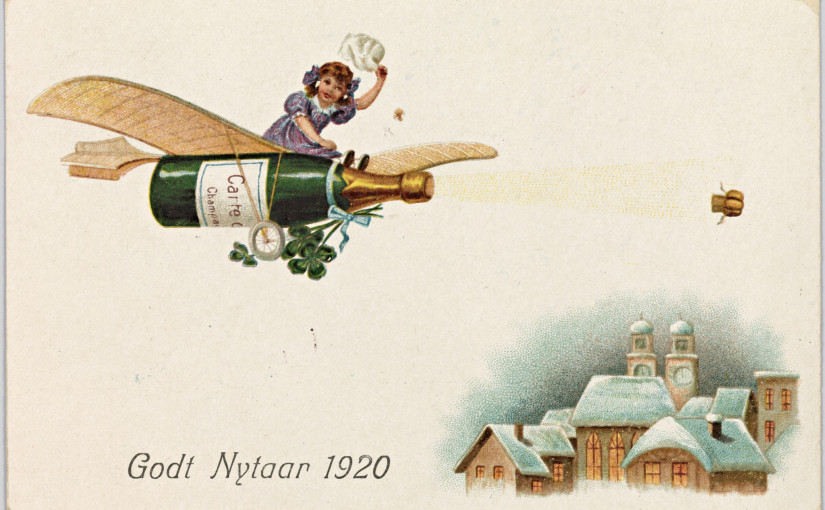
No-one's drinking their own champagne

You don't often hear of people beating on the door of a museum, library or archive asking for linked open data, and most organisations are yet to map their data to specific, widely-used vocabularies because they need to use them in their own work. If technologists in the cultural sector are isolated from people working with collections data and/or research questions, then it's hard for them to appreciate the value of linked data for research projects.

The classical world has benefited from small communities of scholar-technologists – so they're not only drinking their own champagne, they're throwing parties. Smaller, more contained collections of sources and research questions helps create stronger connections and gives people a reason to link their sources. And as we're learning throughout the day, community really helps motivate action.

(I know it's normally called 'eating your own dog food' or 'dogfooding' but I'm vegetarian, so there.)

Linked open data isn't built into collections management systems

Getting linked open data into collections management systems should mean that publishing linked data is an automatic part of sharing data online.

Chicken or the egg?

So it's all a bit 'chicken or the egg' – will it stay that way? Until there's a critical mass, probably. These conversations about linked open data in cultural heritage have been going around for years, but it also shows how far we've come.

[And if you've published open data from cultural heritage collections, linked open data on the classical or ancient world, or any other form of structured data about the past, please add it to the wiki page for museum, gallery, library and archive APIs and machine-readable data sources for open cultural data.]

Drink your own champagne! (Nasjonalbiblioteket image)

Save

Sentiment analysis is opinion turned into code

Modern elections are data visualisation bonanzas, and the 2015 UK General Election is no exception.

Last night seven political leaders presented their views in a televised debate. This morning the papers are full of snap polls, focus groups, body language experts, and graphs based on public social media posts describing the results. Graphs like the one below summarise masses of text using a technique called 'sentiment analysis', a form of computational language processing.* After a twitter conversation with @benosteen and @MLBrook I thought it was worth posting about the inherent biases in the tools that create these visualisations. Ultimately, 'sentiment analysis' is someone's opinion turned into code – so whose opinion are you seeing?

ChartThis is a great time to remember that sentiment analysis – mining text to see what people are talking about and how they feel about it – is based on algorithms and software libraries that were created and configured by people who've made a series of small, accumulative decisions that affect what we see. You can think of sentiment analysis as a sausage factory with the text of tweets as the mince going in one end, and pretty pictures as the product coming out the other end. A healthy democracy needs the list of secret ingredients added during processing, not least because this election prominently features spin rooms and party lines.

What are those 'ingredients'? The software used for sentiment analysis is 'trained' on existing text, and the type of text used affects what the software assumes about the world. For example, software trained on business articles is great at recognising company names but does not do so well on content taken from museum catalogues (unless the inventor of an object went on to found a company and so entered the trained vocabulary). The algorithms used to process text change the output, as does the length of the phrase analysed. The results are riddled with assumptions about tone, intent, the demographics of the poster and more.

In the case of an election, we'd also want to know when the text used for training was created, whether it looks at previous posts by the same person, and how long the software was running over the given texts. Where was the baseline of sentiment on various topics set? Who defines what 'neutral' looks like to an algorithm?

We should ask the same questions about visualisations and computational analysis that we'd ask about any document. The algorithmic 'black box' is a human construction, and just like every other text, software is written by people. Who's paying for it? What sources did they use? If it's an agency promoting their tools, do they mention the weaknesses and probable error rates or gloss over it? If it's a political party (or a company owned by someone associated with a party), have they been scrupulous in weeding out bots? Do retweets count? Are some posters weighted more heavily? Which visualisations were discarded and how did various news outlets choose the visualisations they featured? Which parties are left out?

It matters because, all software has biases, and, as Brandwatch say, 'social media will have a significant role in deciding the outcome of the general election'. And finally, as always, who's not represented in the dataset?

* If you already know this, hopefully you'll know the rest too. This post is deliberately light on technical detail but feel free to add more detailed information in the comments.

Creating simple graphs with Excel's Pivot Tables and Tate's artist data

I've been playing with Tate's collections data while preparing for a workshop on data visualisation. On the day I'll probably use Google Fusion Tables as an example, but I always like to be prepared so I've prepared a short exercise for creating simple graphs in Excel as an alternative.

The advantage of Excel is that you don't need to be online, your data isn't shared, and for many people, gaining additional skills in Excel might be more useful than learning the latest shiny web tool. PivotTables are incredibly useful for summarising data, so it's worth trying them even if you're not interested in visualisations. Pivot tables let you run basic functions – summing, averaging, grouping, etc – on spreadsheet data. If you've ever wanted spreadsheets to be as powerful as databases, pivot tables can help. I could create a pivot table then create a chart from it, but Excel has an option to create a pivot chart directly that'll also create a pivot table for you to see how it works.

For this exercise, you will need Excel and a copy of the sample data: tate_artist_data_cleaned_v1_groupedbybirthyearandgender.xlsx
(A plain text CSV version is also available for broader compatibility: tate_artist_data_cleaned_v1_groupedbybirthyearandgender.csv.)

Work out what data you're interested in

In this example, I'm interested in when the artists in Tate's collection were born, and the overall gender mix of the artists represented. To make it easier to see what's going on, I've copied those two columns of data from the original 'artists' file and copied them over to a new spreadsheet. As a row by row list of births, these columns aren't ideal for charting as they are, so I want a count of artists per year, broken down by gender.

Insert PivotChart

On the 'Insert' menu, click on PivotTable to open the menu and display the option for PivotCharts.
Excel pivot table Insert PivotChart detail

Excel will select our columns as being the most likely thing we want to chart. That all looks fine to me so click 'OK'.

Excel pivot table OK detailConfigure the PivotChart

This screen asking you to 'choose fields from the PivotTable Field List' might look scary, but we've only got two columns of data so you can't really go wrong. Excel pivot table Choose fields

The columns have already been added to the PivotTable Field List on the right, so go ahead and tick the box next to 'gender' and 'yearofBirth'. Excel will probably put them straight into the 'Axis Fields' box.

Leave yearofBirth under Axis Fields and drag 'gender' over to the 'Values' box next to it. Excel automatically turns it into 'count of gender', assuming that we want to sum the number of births per year.

The final task is to drag 'gender' down from the PivotTable Field List to 'Legend Fields' to create a key for which colours represent which gender. You should now see the pivot table representing the calculated values on the left and a graph in the middle.

Close-up of the pivot fields


When you click off the graph, the PivotTable options disappear – just click on the graph or the data again to bring them up.

Excel pivot table Results

You've made your first pivot chart!

You might want to drag it out a bit so the values aren't so squished. Tate's data covers about 500 years so there's a lot to fit in.

Now you've made a pivot chart, have a play – if you get into a mess you can always start again!

Colophon: the screenshots are from Excel 2010 for Windows because that's what I have.

About the data: this data was originally supplied by Tate. The full version on Tate's website includes name, date of birth, place of birth, year of death, place of death and URL on Tate's website. The latest versions of their data can be downloaded from http://www.tate.org.uk/about/our-work/digital/collection-data The source data for this file can be downloaded from https://github.com/tategallery/collection/blob/master/artist_data.csv This version was simplified so it only contains a list of years of birth and the gender of the artist. Some blank values for gender were filled in based on the artist's name or a quick web search; groups of artists or artists of unknown gender were removed as were rows without a birth year. This data was prepared in March 2015 for a British Library course on 'Data Visualisation for Analysis in Scholarly Research' by Mia Ridge.

I'd love to hear if you found this useful or have any suggestions for tweaks.

Looking for (crowdsourcing) love in all the right places

One of the most important exercises in the crowdsourcing workshops I run is the 'speed dating' session. The idea is to spend some time looking at a bunch of crowdsourcing projects until you find a project you love. Finding a project you enjoy gives you a deeper insight into why other people participate in crowdsourcing, and will see you through the work required to get a crowdsourcing project going. I think making a personal connection like this helps reduce some of the cynicism I occasionally encounter about why people would volunteer their time to help cultural heritage collections. Trying lots of projects also gives you a much better sense of the types of barriers projects can accidentally put in the way of participation. It's also a good reminder that everyone is a nerd about something, and that there's a community of passion for every topic you can think of.

If you want to learn more about designing history or cultural heritage crowdsourcing projects, trying out lots of project is a great place to start. The more time you can spend on this the better – an hour is ideal – but trying just one or two projects is better than nothing. In a workshop I get people to note how a project made them feel – what they liked most and least about a project, and who they'd recommend it to. You can also note the input and output types to help build your mental database of relevant crowdsourcing projects.

The list of projects I suggest varies according to the background of workshop participants, and I'll often throw in suggestions tailored to specific interests, but here's a generic list to get you started.

10 Most Wanted http://10most.org.uk/ Research object histories
Ancient Lives http://ancientlives.org/ Humanities, language, text transcription
British Library Georeferencer http://www.bl.uk/maps/ Locating and georeferencing maps (warning: if it's running, only hard maps may be left!)
Children of the Lodz Ghetto http://online.ushmm.org/lodzchildren/ Citizen history, research
Describe Me http://describeme.museumvictoria.com.au/ Describe objects
DIY History http://diyhistory.lib.uiowa.edu/ Transcribe historical letters, recipes, diaries
Family History Transcription Project http://www.flickr.com/photos/statelibrarync/collections/ Document transcription (Flickr/Yahoo login required to comment)
Herbaria@home http://herbariaunited.org/atHome/ (for bonus points, compare it with Notes from Nature https://www.zooniverse.org/project/notes_from_nature) Transcribing specimen sheets (or biographical research)
HistoryPin Year of the Bay 'Mysteries' https://www.historypin.org/attach/project/22-yearofthebay/mysteries/index/ Help find dates, locations, titles for historic photographs; overlay images on StreetView
iSpot http://www.ispotnature.org/ Help 'identify wildlife and share nature'
Letters of 1916 http://dh.tcd.ie/letters1916/ Transcribe letters and/or contribute letters
London Street Views 1840 http://crowd.museumoflondon.org.uk/lsv1840/ Help transcribe London business directories
Micropasts http://crowdsourced.micropasts.org/app/photomasking/newtask Photo-masking to help produce 3D objects; also structured transcription
Museum Metadata Games: Dora http://museumgam.es/dora/ Tagging game with cultural heritage objects (my prototype from 2010)
NYPL Building Inspector http://buildinginspector.nypl.org/ A range of tasks, including checking building footprints, entering addresses
Operation War Diary http://operationwardiary.org/ Structured transcription of WWI unit diaries
Papers of the War Department http://wardepartmentpapers.org/ Document transcription
Planet Hunters http://planethunters.org/ Citizen science; review visualised data
Powerhouse Museum Collection Search http://www.powerhousemuseum.com/collection/database/menu.php Tagging objects
Reading Experience Database http://www.open.ac.uk/Arts/RED/ Text selection, transcription, description.
Smithsonian Digital Volunteers: Transcription Center https://transcription.si.edu/ Text transcription
Tiltfactor Metadata Games http://www.metadatagames.org/ Games with cultural heritage images
Transcribe Bentham http://www.transcribe-bentham.da.ulcc.ac.uk/ History; text transcription
Trove http://trove.nla.gov.au/newspaper?q= Correct OCR errors, transcribe text, tag or describe documents
US National Archives http://www.amara.org/en/teams/national-archives/ Transcribing videos
What's the Score at the Bodleian http://www.whats-the-score.org/ Music and text transcription, description
What's on the menu http://menus.nypl.org/ Structured transcription of restaurant menus
What's on the menu? Geotagger http://menusgeo.herokuapp.com/ Geolocating historic restaurant menus
Wikisource – random item link http://en.wikisource.org/wiki/Special:Random/Index Transcribing texts
Worm Watch http://www.wormwatchlab.org Citizen science; video
Your Paintings Tagger http://tagger.thepcf.org.uk/ Paintings; free-text or structured tagging

NB: crowdsourcing is a dynamic field, some sites may be temporarily out of content or have otherwise settled in transit. Some sites require registration, so you may need to find another site to explore while you're waiting for your registration email.

It's here! Crowdsourcing our Cultural Heritage is now available

My edited volume, Crowdsourcing our Cultural Heritage, is now available! My introduction (Crowdsourcing our cultural heritage: Introduction), which provides an overview of the field and outlines the contribution of the 12 chapters, is online at Ashgate's site, along with the table of contents and index. There's a 10% discount if you order online.

If you're in London on the evening of Thursday 20th November, we're celebrating with a book launch party at the UCL Centre for Digital Humanities. Register at http://crowdsourcingculturalheritage.eventbrite.co.uk.

Here's the back page blurb: "Crowdsourcing, or asking the general public to help contribute to shared goals, is increasingly popular in memory institutions as a tool for digitising or computing vast amounts of data. This book brings together for the first time the collected wisdom of international leaders in the theory and practice of crowdsourcing in cultural heritage. It features eight accessible case studies of groundbreaking projects from leading cultural heritage and academic institutions, and four thought-provoking essays that reflect on the wider implications of this engagement for participants and on the institutions themselves.

Crowdsourcing in cultural heritage is more than a framework for creating content: as a form of mutually beneficial engagement with the collections and research of museums, libraries, archives and academia, it benefits both audiences and institutions. However, successful crowdsourcing projects reflect a commitment to developing effective interface and technical designs. This book will help practitioners who wish to create their own crowdsourcing projects understand how other institutions devised the right combination of source material and the tasks for their ‘crowd’. The authors provide theoretically informed, actionable insights on crowdsourcing in cultural heritage, outlining the context in which their projects were created, the challenges and opportunities that informed decisions during implementation, and reflecting on the results.

This book will be essential reading for information and cultural management professionals, students and researchers in universities, corporate, public or academic libraries, museums and archives."

Massive thanks to the following authors of chapters for their intellectual generosity and their patience with up to five rounds of edits, plus proofing, indexing and more…

  1. Crowdsourcing in Brooklyn, Shelley Bernstein;
  2. Old Weather: approaching collections from a different angle, Lucinda Blaser;
  3. ‘Many hands make light work. Many hands together make merry work’: Transcribe Bentham and crowdsourcing manuscript collections, Tim Causer and Melissa Terras;
  4. Build, analyse and generalise: community transcription of the Papers of the War Department and the development of Scripto, Sharon M. Leon;
  5. What's on the menu?: crowdsourcing at the New York Public Library, Michael Lascarides and Ben Vershbow;
  6. What’s Welsh for ‘crowdsourcing’? Citizen science and community engagement at the National Library of Wales, Lyn Lewis Dafis, Lorna M. Hughes and Rhian James;
  7. Waisda?: making videos findable through crowdsourced annotations, Johan Oomen, Riste Gligorov and Michiel Hildebrand;
  8. Your Paintings Tagger: crowdsourcing descriptive metadata for a national virtual collection, Kathryn Eccles and Andrew Greg.
  9. Crowdsourcing: Crowding out the archivist? Locating crowdsourcing within the broader landscape of participatory archives, Alexandra Eveleigh;
  10.  How the crowd can surprise us: humanities crowdsourcing and the creation of knowledge, Stuart Dunn and Mark Hedges;
  11. The role of open authority in a collaborative web, Lori Byrd Phillips;
  12. Making crowdsourcing compatible with the missions and values of cultural heritage organisations, Trevor Owens.

How did 'play' shape the design and experience of creating Serendip-o-matic?

Here are my notes from the Digital Humanities 2014 paper on 'Play as Process and Product' I did with Brian Croxall, Scott Kleinman and Amy Papaelias based on the work of the 2013 One Week One Tool team.

Scott has blogged his notes about the first part of our talk, Brian's notes are posted as '“If hippos be the Dude of Love…”: Serendip-o-matic at Digital Humanities 2014' and you'll see Amy's work adding serendip-o-magic design to our slides throughout our three posts.

I'm Mia, I was dev/design team lead on Serendipomatic, and I'll be talking about how play shaped both what you see on the front end and the process of making it.

How did play shape the process?

The playful interface was a purposeful act of user advocacy – we pushed against the academic habit of telling, not showing, which you see in some form here. We wanted to entice people to try Serendipomatic as soon as they saw it, so the page text, graphic design, 1 – 2 – 3 step instructions you see at the top of the front page were all designed to illustrate the ethos of the product while showing you how to get started.

How can a project based around boring things like APIs and panic be playful? Technical decision-making is usually a long, painful process in which we juggle many complex criteria. But here we had to practice 'rapid trust' in people, in languages/frameworks, in APIs, and this turned out to be a very freeing experience compared to everyday work.
Serendip-o-matic_ Let Your Sources Surprise You.png
First, two definitions as background for our work…

Just in case anyone here isn't familiar with APIs, APIs are a set of computational functions that machines use to talk to each other. Like the bank in Monopoly, they usually have quite specific functions, like taking requests and giving out information (or taking or giving money) in response to those requests. We used APIs from major cultural heritage repositories – we gave them specific questions like 'what objects do you have related to these keywords?' and they gave us back lists of related objects.
2013-08-01 10.14.45.jpg
The term 'UX' is another piece of jargon. It stands for 'user experience design', which is the combination of graphical, interface and interaction design aimed at making products both easy and enjoyable to use. Here you see the beginnings of the graphic design being applied (by team member Amy) to the underlying UX related to the 1-2-3 step explanation for Serendipomatic.

Feed.

serendipomatic_presentation p9.png
The 'feed' part of Serendipomatic parsed text given in the front page form into simple text 'tokens' and looked for recognisable entities like people, places or dates. There's nothing inherently playful in this except that we called the system that took in and transformed the text the 'magic moustache box', for reasons lost to time (and hysteria).

Whirl.

These terms were then mixed into database-style queries that we sent to different APIs. We focused on primary sources from museums, libraries, archives available through big cultural aggregators. Europeana and the Digital Public Library of America have similar APIs so we could get a long way quite quickly. We added Flickr Commons into the list because it has high-quality, interesting images and brought in more international content. [It also turns out this made it more useful for my own favourite use for Serendipomatic, finding slide or blog post images.] The results are then whirled up so there's a good mix of sources and types of results. This is the heart of the magic moustache.

Marvel.

User-focused design was key to making something complicated feel playful. Amy's designs and the Outreach team work was a huge part of it, but UX also encompasses micro-copy (all the tiny bits of text on the page), interactions (what happened when you did anything on the site), plus loading screens, error messages, user documentation.

We knew lots of people would be looking at whatever we made because of OWOT publicity; you don't get a second shot at this so it had to make sense at a glance to cut through social media noise. (This also meant testing it for mobiles and finding time to do accessibility testing – we wanted every single one of our users to have a chance to be playful.)


Without all this work on the graphic design – the look and feel that reflected the ethos of the product – the underlying playfulness would have been invisible. This user focus also meant removing internal references and in-jokes that could confuse people, so there are no references to the 'magic moustache machine'. Instead, 'Serendhippo' emerged as a character who guided the user through the site.

moustache.png But how does a magic moustache make a process playful?

magicmoustachediagram.jpgThe moustache was a visible signifier of play. It appeared in the first technical architecture diagram – a refusal to take our situation too seriously was embedded at the heart of the project. This sketch also shows the value of having a shared physical or visual reference – outlining the core technical structure gave people a shared sense of how different aspects of their work would contribute to the whole. After all, if there aren't any structure or rules, it isn't a game.

This playfulness meant that writing code (in a new language, under pressure) could then be about making the machine more magic, not about ticking off functions on a specification document. The framing of the week as a challenge and as a learning experience allowed a lack of knowledge or the need to learn new skills to be a challenge, rather than a barrier. My role was to provide just enough structure to let the development team concentrate on the task at hand.

In a way, I performed the role of old-fashioned games master, defining the technical constraints and boundaries much as someone would police the rules of a game. Previous experience with cultural heritage APIs meant I was able to make decisions quickly rather than letting indecision or doubt become a barrier to progress. Just as games often reduce complex situations to smaller, simpler versions, reducing the complexity of problems created a game-like environment.

UX matters


Ultimately, a focus on the end user experience drove all the decisions about the backend functionality, the graphic design and micro-copy and how the site responded to the user.

It's easy to forget that every pixel, line of code or text is there either through positive decisions or decisions not consciously taken. User experience design processes usually involve lots of conversation, questions, analysis, more questions, but at OWOT we didn't have that time, so the trust we placed in each other to make good decisions and in the playful vision for Serendipomatic created space for us to focus on creating a good user experience. The whole team worked hard to make sure every aspect of the design helps people on the site understand our vision so they can get with exploring and enjoying Serendipomatic.

Some possible real-life lessons I didn't include in the paper

One Week One Tool was an artificial environment, but here are some thoughts on lessons that could be applied to other projects:

  • Conversations trump specifications and showing trumps telling; use any means you can to make sure you're all talking about the same thing. Find ways to create a shared vision for your project, whether on mood boards, technical diagrams, user stories, imaginary product boxes. 
  • Find ways to remind yourself of the real users your product will delight and let empathy for them guide your decisions. It doesn't matter how much you love your content or project, you're only doing right by it if other people encounter it in ways that make sense to them so they can love it too (there's a lot of UXy work on 'on-boarding' out there to help with this). User-centred design means understanding where users are coming from, not designing based on popular opinion.you can use tools like customer journey maps to understand the whole cycle of people finding their way to and using your site (I guess I did this and various other UXy methods without articulating them at the time). 
  • Document decisions and take screenshots as you go so that you've got a history of your project – some of this can be done by archiving task lists and user stories. 
  • Having someone who really understands the types of audiences, tools and materials you're working with helps – if you can't get that on your team, find others to ask for feedback – they may be able to save you lots of time and pain.
  • Design and UX resources really do make a difference, and it's even better if those skills are available throughout the agile development process.

How can we connect museum technologists with their history?

A quick post triggered by an article on the role of domain knowledge (knowledge of a field) in critical thinking, Deep in thought:

Domain knowledge is so important because of the way our memories work. When we think, we use both working memory and long-term memory. Working memory is the space where we take in new information from our environment; everything we are consciously thinking about is held there. Long-term memory is the store of knowledge that we can call up into working memory when we need it. Working memory is limited, whereas long-term memory is vast. Sometimes we look as if we are using working memory to reason, when actually we are using long-term memory to recall. Even incredibly complex tasks that seem as if they must involve working memory can depend largely on long-term memory.

When we are using working memory to progress through a new problem, the knowledge stored in long-term memory will make that process far more efficient and successful. … The more parts of the problem that we can automate and store in long-term memory, the more space we will have available in working memory to deal with the new parts of the problem.

A few years ago I defined a 'museum technologist' as 'someone who can appropriately apply a range of digital solutions to help meet the goals of a particular museum project', and deep domain knowledge clearly has a role to play in this (also in the kinds of critical thinking that will save technologists from being unthinking cheerleaders for the newest buzzword or geek toy). 

There's a long history of hard-won wisdom, design patterns and knowledge (whether about ways not to tender for or specify software, reasons why proposed standards may or may not work, translating digital methods and timelines for departments raised on print, etc – I'm sure you all have examples) contained in the individual and collective memory of individual technologists and teams. Some of it is represented in museum technology mailing lists, blogs or conference proceedings, but the lessons learnt in the past aren't always easily discoverable by people encountering digital heritage issues for the first time. And then there's the issue of working out which knowledge relates to specific, outdated technologies and which still holds while not quashing the enthusiasm of new people with a curt 'we tried that before'…

Something in the juxtaposition of the 20th anniversary of BritPop and the annual wave of enthusiasm and discovery from the international Museums and the Web (#MW2014) conference prompted me to look at what the Museums Computer Group (MCG) and Museum Computer Network (MCN) lists were talking about in April five and ten years ago (i.e. in easily-accessible archives):

Five years ago in #musetech – open web, content distribution, virtualisation, wifi https://www.jiscmail.ac.uk/cgi-bin/webadmin?A1=ind0904&L=mcg&X=498A43516F310B2193 http://mcn.edu/pipermail/mcn-l/2009-April/date.html

Ten years ago in #musetech people were talking about knowledge organisation and video links with schools https://www.jiscmail.ac.uk/cgi-bin/webadmin?A1=ind04&L=mcg&F=&S=&X=498A43516F310B2193

Some of the conversations from that random sample are still highly relevant today, and more focused dives into various archives would probably find approaches and information that'd help people tackling current issues.

So how can we help people new to the sector find those previous conversations and get some of this long-term memory into their own working memory? Pointing people to search forms for the MCG and MCN lists is easy, some of the conference proceedings are a bit trickier (e.g. search within the museumsandtheweb.com) and there's no central list of museum technology blogs that I know of. Maybe people could nominate blog posts they think stand the test of time, mindful of the risk of it turning into a popularity/recency thing?

If you're new(ish) to digital heritage, how did you find your feet? Which sites or communities helped you, and how did you find them? Or if you have a new team member, how do you help them get up to speed with museum technology? Or looking further afield, which resources would you send to someone from academia or related heritage fields who wanted to learn about building heritage resources for or with specialists and the public?

Early PhD findings: Exploring historians' resistance to crowdsourced resources

I wrote up some early findings from my PhD research for conferences back in 2012 when I was working on questions around 'but will historians really use resources created by unknown members of the public?'. People keep asking me for copies of my notes (and I've noticed people citing an online video version which isn't ideal) and since they might be useful and any comments would help me write-up the final thesis, I thought I'd be brave and post my notes.

A million caveats apply – these were early findings, my research questions and focus have changed and I've interviewed more historians and reviewed many more participative history projects since then; as a short paper I don't address methods etc; and obviously it's only a huge part of a tiny topic… (If you're interested in crowdsourcing, you might be interested in other writing related to scholarly crowdsourcing and collaboration from my PhD, or my edited volume on 'Crowdsourcing our cultural heritage'.) So, with those health warnings out of the way, here it is. I'd love to hear from you, whether with critiques, suggestions, or just stories about how it relates to your experience. And obviously, if you use this, please cite it!

Exploring historians' resistance to crowdsourced resources

Scholarly crowdsourcing may be seen as a solution to the backlog of historical material to be digitised, but will historians really use resources created by unknown members of the public?

The Transcribe Bentham project describes crowdsourcing as 'the harnessing of online activity to aid in large scale projects that require human cognition' (Terras, 2010a). 'Scholarly crowdsourcing' is a related concept that generally seems to involve the collaborative creation of resources through collection, digitisation or transcription. Crowdsourcing projects often divide up large tasks (like digitising an archive) into smaller, more manageable tasks (like transcribing a name, a line, or a page); this method has helped digitise vast numbers of primary sources.

My doctoral research was inspired by a vision of 'participant digitization', a form of scholarly crowdsourcing that seeks to capture the digital records and knowledge generated when researchers access primary materials in order to openly share and re-use them. Unlike many crowdsourcing projects which are designed for tasks performed specifically for the project, participant digitization harnesses the transcription, metadata creation, image capture and other activities already undertaken during research and aggregates them to create re-usable collections of resources.

Research questions and concepts

When Howe clarified his original definition, stating that the 'crucial prerequisite' in crowdsourcing is 'the use of the open call format and the large network of potential laborers', a 'perfect meritocracy' based not on external qualifications but on 'the quality of the work itself', he created a challenge for traditional academic models of authority and credibility (Howe 2006, 2008). Furthermore, how does anonymity or pseudonymity (defined here as often long-standing false names chosen by users of websites) complicate the process of assessing the provenance of information on sites open to contributions from non-academics? An academic might choose to disguise their identity to mask their research activities from competing peers, from a desire to conduct early exploratory work in private or simply because their preferred username was unavailable; but when contributors are not using their real names they cannot derive any authority from their personal or institutional identity. Finally, which technical, social and scholarly contexts would encourage researchers to share (for example) their snippets of transcription created from archival documents, and to use content transcribed by others? What barriers exist to participation in crowdsourcing or prevent the use of crowdsourced content?

Methods

I interviewed academic and family/local historians about how they evaluate, use, and contribute to crowdsourced and traditional resources to investigate how a resource based on 'meritocracy' disrupts current notions of scholarly authority, reliability, trust, and authorship. These interviews aimed to understand current research practices and probe more deeply into how participants assess different types of resources, their feelings about resources created by crowdsourcing, and to discover when and how they would share research data and findings.

I sought historians investigating the same country and time period in order to have a group of participants who faced common issues with the availability and types of primary sources from early modern England. I focused on academic and 'amateur' family or local historians because I was interested in exploring the differences between them to discover which behaviours and attitudes are common to most researchers and which are particular to academics and the pressures of academia.

I recruited participants through personal networks and social media, and conducted interviews in person or on Skype. At the time of writing, 17 participants have been interviewed for up to 2 hours each. It should be noted that these results are of a provisional nature and represent a snapshot of on-going research and analysis.

Early results

I soon discovered that citizen historians are perfect examples of Pro-Ams: 'knowledgeable, educated, committed, and networked' amateurs 'who work to professional standards' (Leadbeater and Miller, 2004; Terras, 2010b).

How do historians assess the quality of resources?

Participants often simply said they drew on their knowledge and experience when sniffing out unreliable documents or statements. When assessing secondary sources, their tacit knowledge of good research and publication practices was evident in common statements like '[I can tell from] it's the way it's written'. They also cited the presence and quality of footnotes, and the depth and accuracy of information as important factors. Transcribed sources introduced another layer of quality assessment – researchers might assess a resource by checking for transcription errors that are often copied from one database to another. Most researchers used multiple sources to verify and document facts found in online or offline sources.

When and how do historians share research data and findings?

It appears that between accessing original records and publishing information, there are several key stages where research data and findings might be shared. Stages include acquiring and transcribing records, producing visualisations like family trees and maps, publishing informal notes and publishing synthesised content or analysis; whether a researcher passes through all the stages depends on their motivation and audience. Information may change formats between stages, and since many claim not to share information that has not yet been sufficiently verified, some information would drop out before each stage. It also appears that in later stages of the research process the size of the potential audience increases and the level of trust required to share with them decreases.

For academics, there may be an additional, post-publication stage when resources are regarded as 'depleted' – once they have published what they need from them, they would be happy to share them. Family historians meanwhile see some value in sharing versions of family trees online, or in posting names of people they are researching to attract others looking for the same names.

Sharing is often negotiated through private channels and personal relationships. Methods of controlling sharing include showing people work in progress on a screen rather than sending it to them and using email in preference to sharing functionality supplied by websites – this targeted, localised sharing allows the researcher to retain a sense of control over early stage data, and so this is one key area where identity matters. Information is often shared progressively, and getting access to more information depends on your behaviour after the initial exchange – for example, crediting the provider in any further use of the data, or reciprocating with good data of your own.

When might historians resist sharing data?

Participants gave a range of reasons for their reluctance to share data. Being able to convey the context of creation and the qualities of the source materials is important for historians who may consider sharing their 'depleted' personal archives – not being able to provide this means they are unlikely to share. Being able to convey information about data reliability is also important. Some information about the reliability of a piece of information is implicitly encoded in its format (for example, in pencil in notebooks versus electronic records), hedging phrases in text, in the number of corroborating sources, or a value judgement about those sources. If it is difficult to convey levels of 'certainty' about reliability when sharing data, it is less likely that people will share it – participants felt a sense of responsibility about not publishing (even informally) information that hasn't been fully verified. This was particularly strong in academics. Some participants confessed to sneaking forbidden photos of archival documents they ran out of time to transcribe in the archive; unsurprisingly it is unlikely they would share those images.

Overall, if historians do not feel they would get information of equal value back in exchange, they seem less likely to share. Professional researchers do not want to give away intellectual property, and feel sharing data online is risky because the protocols of citation and fair use are presently uncertain. Finally, researchers did not always see a point in sharing their data. Family history content was seen as too specific and personal to have value for others; academics may realise the value of their data within their own tightly-defined circles but not realise that their records may have information for other biographical researchers (i.e. people searching by name) or other forms of history.

Which concerns are particular to academic historians?

Reputational risk is an issue for some academics who might otherwise share data. One researcher said: 'we are wary of others trawling through our research looking for errors or inconsistencies. […] Obviously we were trying to get things right, but if we have made mistakes we don't want to have them used against us. In some ways, the less you make available the better!'. Scholarly territoriality can be an issue – if there is another academic working on the same resources, their attitude may affect how much others share. It is also unclear how academic historians would be credited for their work if it was performed under a pseudonym that does not match the name they use in academia.

What may cause crowdsourced resources to be under-used?

In this research, 'amateur' and academic historians shared many of the same concerns for authority, reliability, and trust. The main reported cause of under-use (for all resources) is not providing access to original documents as well as transcriptions. Researchers will use almost any information as pointers or leads to further sources, but they will not publish findings based on that data unless the original documents are available or the source has been peer-reviewed. Checking the transcriptions against the original is seen as 'good practice', part of a sense of responsibility 'to the world's knowledge'.

Overall, the identity of the data creator is less important than expected – for digitised versions of primary sources, reliability is not vested in the identity of the digitiser but in the source itself. Content found on online sites is tested against a set of finely-tuned ideas about the normal range of documents rather than the authority of the digitiser.

Cite as:

Ridge, Mia. “Early PhD Findings: Exploring Historians’ Resistance to Crowdsourced Resources.” Open Objects, March 19, 2014. https://www.openobjects.org.uk/2014/03/early-phd-findings-exploring-historians-resistance-to-crowdsourced-resources/.

References

Howe, J. (undated). Crowdsourcing: A Definition http://crowdsourcing.typepad.com

Howe, J. (2006). Crowdsourcing: A Definition. http://crowdsourcing.typepad.com/cs/2006/06/crowdsourcing_a.html

Howe, J. (2008). Join the crowd: Why do multinationals use amateurs to solve scientific and technical problems? The Independent. http://www.independent.co.uk/life-style/gadgets-and-tech/features/join-the-crowd-why-do-multinationals-use-amateurs-to-solve-scientific-and-technical-problems-915658.html

Leadbeater, C., and Miller, P. (2004). The Pro-Am Revolution: How Enthusiasts Are Changing Our Economy and Society. Demos, London, 2004. http://www.demos.co.uk/files/proamrevolutionfinal.pdf

Terras, M. (2010a) Crowdsourcing cultural heritage: UCL's Transcribe Bentham project. Presented at: Seeing Is Believing: New Technologies For Cultural Heritage. International Society for Knowledge Organization, UCL (University College London). http://eprints.ucl.ac.uk/20157/

Terras, M. (2010b). “Digital Curiosities: Resource Creation via Amateur Digitization.” Literary and Linguistic Computing 25, no. 4 (October 14, 2010): 425–438. http://llc.oxfordjournals.org/cgi/doi/10.1093/llc/fqq019

2013 in review: crowdsourcing, digital history, visualisation, and lots and lots of words

A quick and incomplete summary of my 2013 for those days when I wonder where the year went… My PhD was my main priority throughout the year, but the slow increase in word count across my thesis is probably only of interest to me and my supervisors (except where I've turned down invitations to concentrate on my PhD). Various other projects have spanned the years: my edited volume on 'Crowdsourcing our Cultural Heritage', working as a consultant on the 'Let's Get Real' project with Culture24, and I've continued to work with the Open University Digital Humanities Steering Group, ACH and to chair the Museums Computer Group.

In January (and April/June) I taught all-day workshops on 'Data Visualisation for Analysis in Scholarly Research' and 'Crowdsourcing in Libraries, Museums and Cultural Heritage Institutions' for the British Library's Digital Scholarship Training Programme.

In February I was invited to give a keynote on 'Crowd-sourcing as participation' at iSay: Visitor-Generated Content in Heritage Institutions in Leicester (my event notes). This was an opportunity to think through the impact of the 'close reading' people do while transcribing text or describing images, crowdsourcing as a form of deeper engagement with cultural heritage, and the potential for 'citizen history' this creates (also finally bringing together my museum work and my PhD research). This later became an article for Curator journal, From Tagging to Theorizing: Deepening Engagement with Cultural Heritage through Crowdsourcing (proof copy available at http://oro.open.ac.uk/39117). I also ran a workshop on 'Data visualisation for humanities researchers' with Dr. Elton Barker (one of my PhD supervisors) for the CHASE 'Going Digital' doctoral training programme.

In March I was in the US for THATCamp Feminisms in Claremont, California (my notes), to do a workshop on Data visualisation as a gateway to programming and I gave a paper on 'New Challenges in Digital History: Sharing Women's History on Wikipedia' at the Women's History in the Digital World' conference at Bryn Mawr, Philadelphia (posted as 'New challenges in digital history: sharing women's history on Wikipedia – my draft talk notes'). I also wrote an article for Museum Identity magazine, Where next for open cultural data in museums?.

In April I gave a paper, 'A thousand readers are wanted, and confidently asked for': public participation as engagement in the arts and humanities, on my PhD research at Digital Impacts: Crowdsourcing in the Arts and Humanities (see also my notes from the event), and a keynote on 'A Brief History of Open Cultural Data' at GLAM-WIKI 2013.

In May I gave an online seminar on crowdsourcing (with a focus on how it might be used in teaching undergraduates wider skills) for the NITLE Shared Academics series. I gave a short paper on 'Digital participation and public engagement' at the London Museums Group's 'Museums and Social Media' at Tate Britain on May 24, and was in Belfast for the Museums Computer Group's Spring meeting, 'Engaging Visitors Through Play' then whipped across to Venice for a quick keynote on 'Participatory Practices: Inclusion, Dialogue and Trust' (with Helen Weinstein) for the We Curate kick-off seminar at the start of June.

In June the Collections Trust and MCG organised a Museum Informatics event in York and we organised a 'Failure Swapshop' the evening before. I also went to Zooniverse's ZooCon (my notes on the citizen science talks) and to Canterbury Cathedral Archives for a CHASE event on 'Opening up the archives: Digitization and user communities'.

In July I chaired a session on Digital Transformations at the Open Culture 2013 conference in London on July 2, gave an invited lightning talk at the Digital Humanities Oxford Summer School 2013, ran a half-day workshop on 'Designing successful digital humanities crowdsourcing projects' at the Digital Humanities 2013 conference in Nebraska, and had an amazing time making what turned out to be Serendip-o-matic at the Roy Rosenzweig Center for History and New Media at George Mason University's One Week, One Tool in Fairfax, Virginia (my posts on the process), with a museumy road trip via Amtrak and Greyhound to Chicago, Cleveland, Pittsburg inbetween the two events.

In August I tidied up some talk notes for publication as 'Tips for digital participation, engagement and crowdsourcing in museums' on the London Museums Group blog.

October saw the publication of my Curator article and Creating Deep Maps and Spatial Narratives through Design with Don Lafreniere and Scott Nesbit for the International Journal of Humanities and Arts Computing, based on our work at the Summer 2012 NEH Advanced Institute on Spatial Narrative and Deep Maps: Explorations in the Spatial Humanities. (I also saw my family in Australia and finally went to MONA).

In November I presented on 'Messy understandings in code' at Speaking in Code at UVA's Scholars' Lab, Charlottesville, Virginia, gave a half-day workshop on 'Data Visualizations as an Introduction to Computational Thinking' at the University of Manchester and spoke at the Digital Humanities at Manchester conference the next day. Then it was down to London for the MCG's annual conference, Museums on the Web 2013 at Tate Modern. Later than month I gave a talk on 'Sustaining Collaboration from Afar' at Sustainable History: Ensuring today's digital history survives.

In December I went to Hannover, Germany for the Herrenhausen Conference: "(Digital) Humanities Revisited – Challenges and Opportunities in the Digital Age" where I presented on 'Creating a Digital History Commons through crowdsourcing and participant digitisation' (my lightning talk notes and poster are probably the best representation of how my PhD research on public engagement through crowdsourcing and historians' contributions to scholarly resources through participant digitisation are coming together). In final days of 2013, I went back to my old museum metadata games, and updated them to include images from the British Library and took a first pass at making them responsive for mobile and tablet devices.

Why we need to save the material experience of software objects

Conversations at last month's Sustainable History: Ensuring today's digital history survives event [my slides] (and at the pub afterwards) touched on saving the data underlying websites as a potential solution for archiving them. This is definitely better than nothing, but as a human-computer interaction researcher and advocate for material culture in historical research, I don't think it's enough.

Just as people rue the loss of the information and experiential data conveyed by the material form of objects when they're converted to digital representations – size, paper and print/production quality, marks from wear through use and manufacture, access to its affordances, to name a few – future researchers will rue the information lost if we don't regard digital interfaces and user experiences as vital information about the material form of digital content and record them alongside the data they present.

Can you accurately describe the difference between using MySpace and Facebook in their various incarnations? There's no perfect way to record the experience of using Facebook in December 2013 so it could be compared with the experience of using MySpace in 2005, but usability techniques like screen-recording software linked to eyetracking or think-aloud tests would help preserve some of the tacit knowledge and context users bring to sites alongside the look-and-feel, algorithms and treatments of data the sites present to us. It's not a perfect solution, but a recording of the interactions and designs from both sites for common tasks like finding and adding a friend would tell future researchers infinitely more about changes to social media sites over eight years than simple screenshots or static webpages. But in this case we're still missing the notifications on other people's screens, the emails and algorithmic categorisations that fan out from simple interactions like these…

Even if you don't care about history, anyone studying software – whether websites, mobile apps, digital archives, instrument panels or procedural instructions embedded in hardware – still needs solid methods for capturing the dynamic and subjective experience of using digital technologies. As Lev Manovich says in The Algorithms of Our Lives, when we use software we're "engaging with the dynamic outputs of computation; studying software culture requires us to "record and analyze interactive experiences, following individual users as they navigate a website or play a video game … to watch visitors of an interactive installation as they explore the possibilities defined by the designer—possibilities that become actual events only when the visitors act on them".

The Internet Archive does a great job, but in researching the last twenty years of internet history I'm constantly hitting the limits of their ability to capture dynamic content, let alone the nuance of interfaces. The paradox is that as more of our experiences are mediated through online spaces and the software contained within small boxy devices, we risk leaving fewer traces of our experiences than past generations.