It's not easy to find the abstracts for presentations within panels on the Digital Humanities 2019 (DH2019) site, so I've shared mine here.
In search of the sweet spot: infrastructure at the intersection of cultural heritage and data science
Mia Ridge, British Library
This paper explores some of the challenges and paradoxes in the application of data science methods to cultural heritage collections. It is drawn from long experience in the cultural heritage sector, predating but broadly aligned to the 'OpenGLAM' and 'Collections as Data' movements. Experiences that have shaped this thinking include providing open cultural data for computational use; creating APIs for catalogue and interpretive records, running hackathons, and helping cultural organisations think through the preparation of 'collections as data'; and supervising undergraduate and MSc projects for students of computer science.
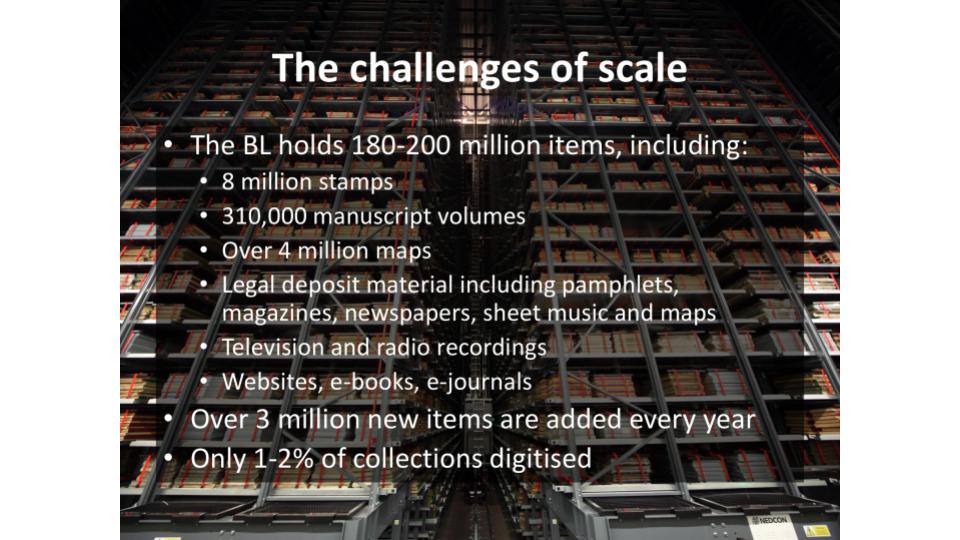
The opportunities are many. Cultural heritage institutions (aka GLAMS – galleries, libraries, archives and museums) hold diverse historical, scientific and creative works – images, printed and manuscript works, objects, audio or video – that could be turned into some form of digital 'data' for use in data science and digital humanities research. GLAM staff have expert knowledge about the collections and their value to researchers. Data scientists bring a rigour, specialist expertise and skills, and a fresh perspective to the study of cultural heritage collections.
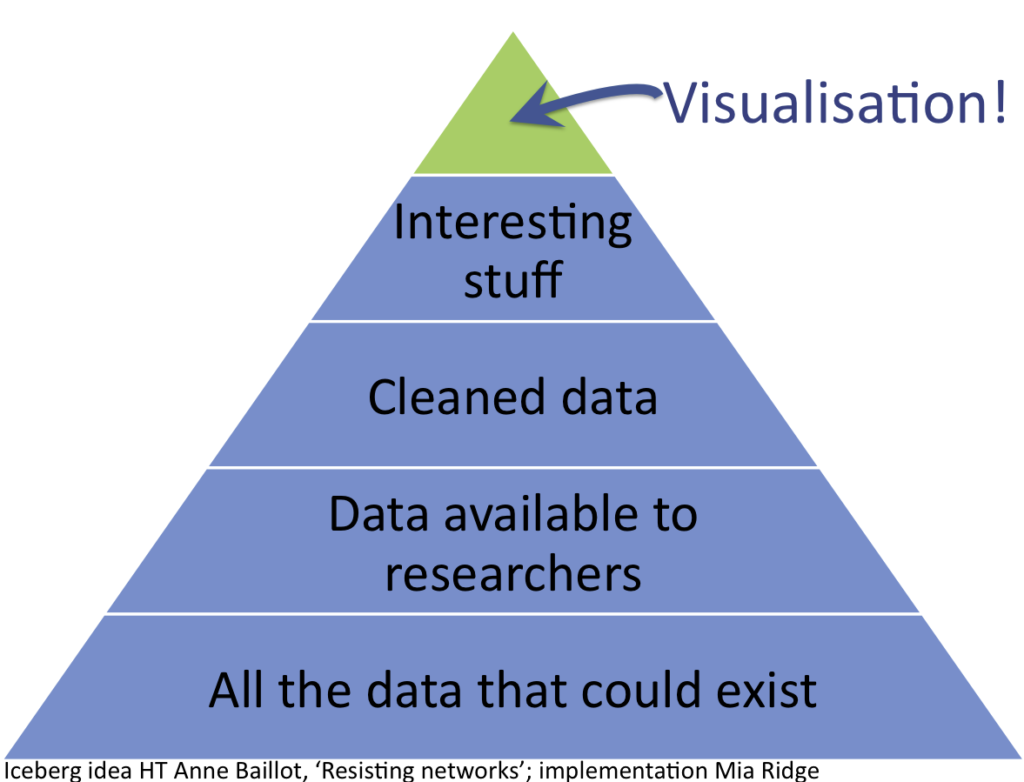
While the quest to publish cultural heritage records and digital surrogates for use in data science is relatively new, the barriers within cultural organisations to creating suitable infrastructure with others are historically numerous. They include different expectations about the pace and urgency of work, different levels of technical expertise, resourcing and infrastructure, and different goals. They may even include different expectations about what 'data' is – metadata drawn from GLAM catalogues is the most readily available and shared data, but not only is this rarely complete, often untidy and inconsistent (being the work of decades or centuries and many hands over that time), it is also a far cry from datasets rich with images or transcribed text that data scientists might expect.
Copyright, data protection and commercial licensing can limit access to digitised materials (though this varies greatly). 'Orphaned works', where the rights holder cannot be traced in order to licence the use of in-copyright works, mean that up to 40% of some collections, particularly sound or video collections, are unavailable for risk-free use.(2012)
While GLAMs have experimented with APIs, downloadable datasets and SPARQL endpoints, they rarely have the resources or institutional will to maintain and refresh these indefinitely. Records may be available through multi-national aggregators such as Europeana, DPLA, or national aggregators, but as aggregation often requires that metadata is mapped to the lowest common denominator, their value for research may be limited.
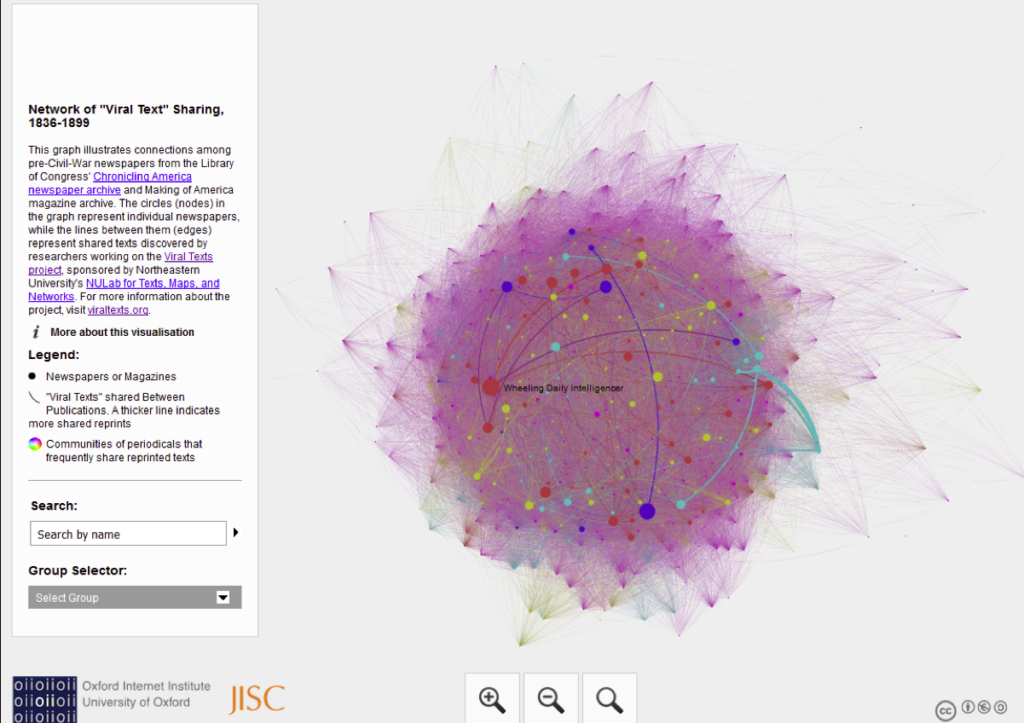
The area of overlap between 'computationally interesting problems' and 'solutions useful for GLAMs' may be smaller than expected to date, but collaboration between cultural institutions and data scientists on shared projects in the 'sweet spot' – where new data science methods are explored to enhance the discoverability of collections – may provide a way forward. Sector-wide collaborations like the International Image Interoperability Framework (IIIF, https://iiif.io/) provide modern models for lightweight but powerful standards. Pilot projects with students or others can help test the usability of collection data and infrastructure while exploring the applicability of emerging technologies and methods. It is early days for these collaborations, but the future is bright.
Panel overview
An excerpt from the longer panel description by David Beavan and Barbara McGillivray.
This panel highlights the emerging collaborations and opportunities between the fields of Digital Humanities (DH), Data Science (DS) and Artificial Intelligence (AI). It charts the enthusiastic progress of the Alan Turing Institute, the UK national institute for data science and artificial intelligence, as it engages with cultural heritage institutions and academics from arts, humanities and social sciences disciplines. We discuss the exciting work and learnings from various new activities, across a number of high-profile institutions. As these initiatives push the intellectual and computational boundaries, the panel considers both the gains, benefits, and complexities encountered. The panel latterly turns towards the future of such interdisciplinary working, considering how DS & DH collaborations can grow, with a view towards a manifesto. As Data Science grows globally, this panel session will stimulate new discussion and direction, to help ensure the fields grow together and arts & humanities remain a strong focus of DS & AI. Also so DH methods and practices continue to benefit from new developments in DS which will enable future research avenues and questions.